





.png)


Preparation and Storage


推奨アッセイ手順
BD® CompBeads can be used as surrogates to assess fluorescence spillover (Compensation). When fluorochrome conjugated antibodies are bound to BD® CompBeads, they have spectral properties very similar to cells. However, for some fluorochromes there can be small differences in spectral emissions compared to cells, resulting in spillover values that differ when compared to biological controls. It is strongly recommended that when using a reagent for the first time, users compare the spillover on cells and BD CompBeads to ensure that BD® CompBeads are appropriate for your specific cellular application.
Product Notices
- Since applications vary, each investigator should titrate the reagent to obtain optimal results.
- An isotype control should be used at the same concentration as the antibody of interest.
- Although hamster immunoglobulin isotypes have not been well defined, BD Biosciences Pharmingen has grouped Armenian and Syrian hamster IgG monoclonal antibodies according to their reactivity with a panel of mouse anti-hamster IgG mAbs. A table of the hamster IgG groups, Reactivity of Mouse Anti-Hamster Ig mAbs, may be viewed at http://www.bdbiosciences.com/documents/hamster_chart_11x17.pdf.
- Caution: Sodium azide yields highly toxic hydrazoic acid under acidic conditions. Dilute azide compounds in running water before discarding to avoid accumulation of potentially explosive deposits in plumbing.
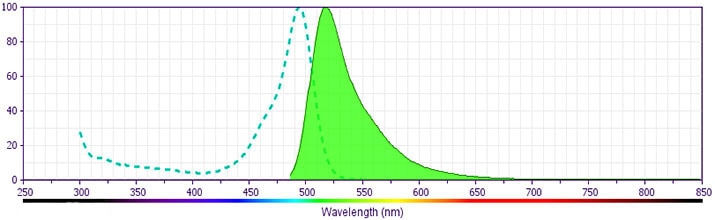
- For fluorochrome spectra and suitable instrument settings, please refer to our Multicolor Flow Cytometry web page at www.bdbiosciences.com/colors.
- Please refer to www.bdbiosciences.com/us/s/resources for technical protocols.
- Please refer to http://regdocs.bd.com to access safety data sheets (SDS).
関連製品
.png?imwidth=320)
The 145-2C11 monoclonal antibody specifically binds to the 25-kDa ε chain of the T-cell receptor-associated CD3 complex that is expressed on thymocytes, mature T lymphocytes, and NK-T cells. The cytoplasmic domain of CD3e participates in the signal transduction events that activate several cellular biochemical pathways as a result of antigen recognition. Soluble 145-2C11 antibody can activate either unprimed (naive) or primed (memory/preactivated) T cells in vivo or in vitro, in the presence of Fc receptor-bearing accessory cells. In contrast, plate-bound 145-2C11 can activate T cells in the absence of accessory cells. Soluble 145-2C11 antibody has been reported to induce re-directed lysis of Fc receptor-bearing target cells by CTL clones and can also block lysis of specific target cells by antigen-specific CTL's. Under some conditions, T-cell activation by 145-2C11 antibody has been reported to result in apoptotic cell death. The 145-2C11 antibody does not cross-react with rat leukocytes. Preincubation of thymus cell suspensions at 37°C for 2-4 hours prior to staining reportedly enhances the ability of anti-CD3ε and anti-αβ TCR mAbs to detect the T-cell receptor on immature thymocytes.
Development References (15)
-
Castro JE, Listman JA, Jacobson BA, et al. Fas modulation of apoptosis during negative selection of thymocytes. Immunity. 1996; 5(6):617-627. (Clone-specific: Activation, Apoptosis). View Reference
-
Duke RC, Cohen JJ, Boehme SA, et al. Morphological, biochemical, and flow cytometric assays of apoptosis. In: Coligan J, Kruisbeek AM, Margulies D, Shevach EM, Strober W, ed. Current Protocols in Immunology. New York: John Wiley and Sons; 1995:3.17.1-3.17.33.
-
Ernst DN, Weigle WO, McQuitty DN, Rothermel AL, Hobbs MV. Stimulation of murine T cell subsets with anti-CD3 antibody. Age-related defects in the expression of early activation molecules. J Immunol. 1989; 142(5):1413-1421. (Clone-specific: Activation, Functional assay, Stimulation). View Reference
-
Fagarasan S, Muramatsu M, Suzuki K, Nagaoka H, Hiai H, Honjo T. Critical roles of activation-induced cytidine deaminase in the homeostasis of gut flora. Science. 2002; 298(5597):1424-1427. (Biology: Fluorescence microscopy, Immunofluorescence). View Reference
-
Isakov N, Wange RL, Burgess WH, Watts JD, Aebersold R, Samelson LE. ZAP-70 binding specificity to T cell receptor tyrosine-based activation motifs: the tandem SH2 domains of ZAP-70 bind distinct tyrosine-based activation motifs with varying affinity. J Exp Med. 1995; 181(1):375-380. (Biology: Immunoprecipitation). View Reference
-
Kruisbeek AM, Shevach EM. Proliferative assays for T cell function. Curr Protoc Immunol. 2004; 3:3.12.1-3.12.14. (Methodology: Activation, Stimulation). View Reference
-
Kubo RT, Born W, Kappler JW, Marrack P, Pigeon M. Characterization of a monoclonal antibody which detects all murine alpha beta T cell receptors. J Immunol. 1989; 142(8):2736-2742. (Biology). View Reference
-
Leo O, Foo M, Sachs DH, Samelson LE, Bluestone JA. Identification of a monoclonal antibody specific for a murine T3 polypeptide. Proc Natl Acad Sci U S A. 1987; 84(5):1374-1378. (Immunogen: Blocking, Cytotoxicity, Immunoprecipitation, Stimulation). View Reference
-
Nakano H, Yamazaki T, Miyatake S, Nozaki N, Kikuchi A, Saito T. Specific interaction of topoisomerase II beta and the CD3 epsilon chain of the T cell receptor complex. J Biol Chem. 1996; 271(11):6483-6489. (Biology: Immunoprecipitation). View Reference
-
Portoles P, Rojo J, Golby A, et al . Monoclonal antibodies to murine CD3 epsilon define distinct epitopes, one of which may interact with CD4 during T cell activation. J Immunol. 1989; 142(12):4169-4175. (Biology: Activation, Immunoprecipitation, Stimulation). View Reference
-
Radvanyi LG, Mills GB, Miller RG. Religation of the T cell receptor after primary activation of mature T cells inhibits proliferation and induces apoptotic cell death. J Immunol. 1993; 150(12):5704-5715. (Clone-specific: Activation, Apoptosis). View Reference
-
Salvadori S, Gansbacher B, Pizzimenti AM, Zier KS. Abnormal signal transduction by T cells of mice with parental tumors is not seen in mice bearing IL-2-secreting tumors. J Immunol. 1994; 153(11):5176-5182. (Clone-specific: Activation, Calcium Flux, Flow cytometry, Western blot). View Reference
-
Shinkai Y, Alt FW. CD3 epsilon-mediated signals rescue the development of CD4+CD8+ thymocytes in RAG-2-/- mice in the absence of TCR beta chain expression. Int Immunol. 1994; 6(7):995-1001. (Biology: Activation, Stimulation). View Reference
-
Ucker DS, Meyers J, Obermiller PS. Activation-driven T cell death. II. Quantitative differences alone distinguish stimuli triggering nontransformed T cell proliferation or death. J Immunol. 1992; 149(5):1583-1592. (Clone-specific: Activation, Apoptosis). View Reference
-
Wang R, Murphy KM, Loh DY, Weaver C, Russell JH. Differential activation of antigen-stimulated suicide and cytokine production pathways in CD4+ T cells is regulated by the antigen-presenting cell. J Immunol. 1993; 150(9):3832-3842. (Clone-specific: Activation, Apoptosis). View Reference
Please refer to Support Documents for Quality Certificates
Global - Refer to manufacturer's instructions for use and related User Manuals and Technical data sheets before using this products as described
Comparisons, where applicable, are made against older BD Technology, manual methods or are general performance claims. Comparisons are not made against non-BD technologies, unless otherwise noted.
For Research Use Only. Not for use in diagnostic or therapeutic procedures.
