





BD Cellismo™ Data Visualization Tool是一款用于单细胞多组学数据的二次分析及可视化的软件工具。研究人员无需编程即可实现百万级数据点的系统分析。
通过BD Cellismo™ Data Visualization Tool,您可以轻松基于多种参数对样本数据进行可视化分析;根据基因表达谱进行细胞亚群划分;生成直方图、热图、点图、火山图、小提琴图、tSNE图和UMAP图;自定义图表并导出为.PNG或.SVG文件,便于科研协作与成果发表。
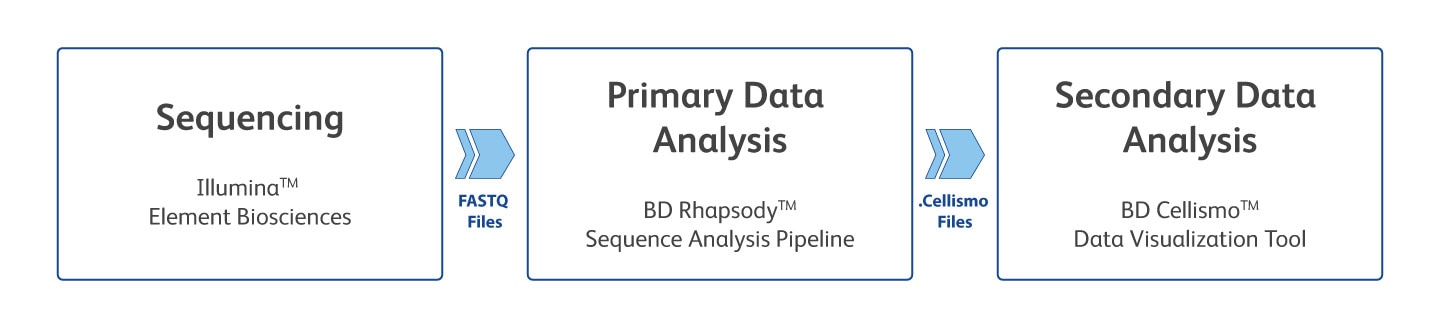
观看视频,了解如何使用 BD Rhapsody™ Sequence Analysis Pipeline, 进行初步分析,并结合BD Cellismo™ Data Visualization Tool进行二次分析。
-

直观易用: 点击即可将数据可视化,一键生成专业图表
-

用户友好: 无需编程基础,轻松上手
-

多组学支持:轻松探索单细胞RNA和蛋白质数据集。
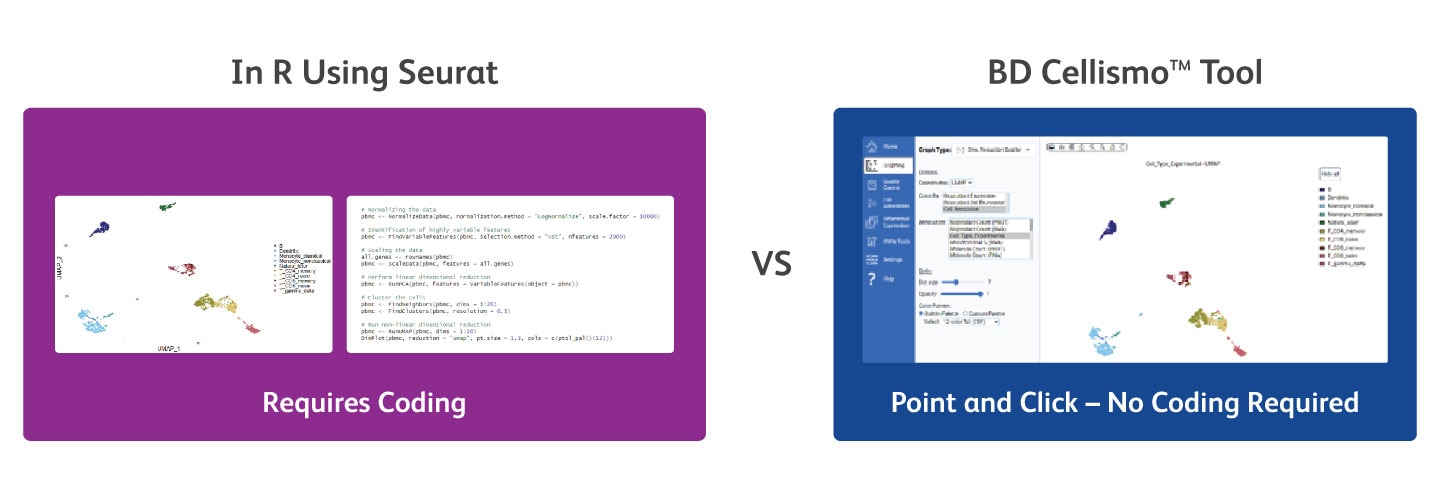
无需编写任何代码或编程,即可使用BD Cellismo™ Data Visualization Tool生成与Seurat相同的数据可视化结果
使用BD Cellismo™ Data Visualization Tool(右),您无需编写任何代码,即可生成与Seurat(左)相同的数据可视化结果。BD Cellismo™ Data Visualization Tool操作界面直观,让您通过点击操作,轻松自定义图表参数(例如,点大小、颜色、不透明度)。
输入要求:
对于WTA或AbSeq数据:
- (推荐格式)来自 BD Rhapsody™ Sequence Analysis Pipeline. 的.Cellismo输出文件。
- 其他支持的输入格式:
- Market exchange(MEX)
- H5MU/H5AD
- Seurat .rds
- Market exchange(MEX)压缩格式(.zip或tar.gz)
- H5
- 来自BD Rhapsody™序列分析流程的Cellismo输出文件(仅支持V3及更高版本)
-
当前版本:v3.0 | 发布日期:2026年9月
新增功能
- 支持 BD Rhapsody™ TCR/BCR Next 多组学
- 新增AIRR分析模态,兼容符合AIRR标准的重排TSV文件与仅VDJ 数据集
- 支持多组TCR/BCR数据集的合并与分析
- 支持修改分析流程(BD pipeline)默认提供的细胞类型注释,以指定用于TCR/BCR分析的细胞
- 支持自定义克隆型与克隆扩增注释分类
- 支持查看克隆型大小分布与丰度图
- 通过可检索表格、交互式蜂窝图与柱状图探索克隆型;支持按细胞注释或基因表达量着色,并筛选排名靠前的克隆型
- 在整个软件中,可将克隆型定义作为细胞注释,例如:
- 跨克隆型开展差异表达分析
- 通过热图、直方图与小提琴图对比不同克隆型之间的基因表达差异
- 在降维图上展示特定克隆型
- 查看同一克隆型下contig的核苷酸/氨基酸序列多序列比对结果,并支持FASTA格式导出
- 支持在不同分类注释之间,比较克隆型重叠度,优势克隆/选定克隆的频率变化
- 支持在不同的分类注释之间,比较免疫组库的多样性、丰富度与优势克隆占比
- 支持查看单个与联合基因片段使用情况,包括配对链的使用信息
- 支持查看CDR3长度分布与序列基序特征
- 支持B细胞谱系示踪分析
- 整体质量控制:新增ATAC数据的峰内转座酶位点占比、TSS富集分数与核小体信号得分等质控指标
更新内容- 更新最终用户许可协议
问题修复- 双细胞检测:修复重新运行后细胞误删问题
- 双轴图:修复在已有细胞注释内新建注释分类时出现的界面卡死问题
- 双轴图:修复未打开项目时选择坐标轴触发的界面死问题
- 支持 BD Rhapsody™ TCR/BCR Next 多组学
-
Previous Version: v2.1 | Release Date: June 2026
Added:
- Trajectory analysis utility tool using PAGA
- Cell Cycle analysis utility tool
- ATAC Browser: Gene/peak correlation track with arcs colored by correlation score
- ATAC Browser: Added an RNA expression violin plot, enabling combined view of a gene's genomic region and expression
- Stacked Bar new graph type—view categorical annotations stacked vertically and optionally split by a second categorical annotation. Useful for cell type proportion analysis and more
- Biaxial Graph: Added hexbin density visualization
- Biaxial Graph: Added numerical annotations as options for X and Y axis
- Bioproduct Correlation Graph: Added 'scaled sum' aggregation type, to correct for differences in cell number between categories
- Export Format: Added export for ATAC modalities to the HDF5 format to enable Seurat import
- Export Format: Added ability to split CSV and FCS exports to individual files by any categorical cell annotation
- Application update notifications and built-in streamlined update mechanism
- Optional anonymous telemetry to help us improve the product. Does not transmit any single-cell data
Updated:
- Continuous color palette selector shows the color range during selection
- ATAC Browser: optimized reloading and redrawing operations to make usage faster
- ATAC Browser: settings sidebar can be collapsed
- ATAC Motif Enrichment: motif logos added to the table of results
- Bioproduct Correlation Graph: Updated aggregation functions to always operate on the linear scale
- Classify Cell Types: allow overwrite of an existing cell annotation
- Dimensionality Reduction Graph: Updated legend to allow selection cells from categorical annotation labels
- Project Start: Improved speed of import for Seurat objects
Fixed:
- Violin and Histogram graphs: fixed errors when using 'Deselect all' categories
- Project Start: H5MU import—modalities that are not recognized are ignored
-
Previous Version: v2.0.1 | Release Date: February 2026
Added:
• ATAC Browser: Transcription Start Site track
Updated:• ATAC Browser: Better performance by caching data
Fixed:- Doublet Detection or QC Remove Categorical: Removing cells by these mechanisms causes the bioproduct list to fail, displaying "Object:object" until the project is reloaded
- Start Project: ATAC Fragment file merging can fail when loading two or more ATAC-Seq datasets that used a custom reference genome
- ATAC Browser: Better handling of chromosome names from custom species reference
- Differential Analysis: Method DESeq2 failure
-
Previous Version: v2.0 | Release Date: October 2025
Added:
- Support for BD Rhapsody™ ATAC-Seq Assay
- New modalities: ATAC_PEAKS, ATAC_GENE_ACTIVITY, ATAC_MOTIF
- Genome browser to view ATAC peaks and ATAC fragments in the context of genomic locations and genes
- Motif enrichment analysis tool—find transcription factor motifs that are enriched in a given set of peaks, compared to background peaks
- Peak and RNA expression correlation tool—find peaks whose activity correlate with RNA expression
- RNA vs ATAC heatmap—see RNA expression and ATAC gene activity correlation for a given cell annotation
- Ability to combine and reanalyze multiple ATAC datasets
- Doublet detection tool
- Batch correction utility tool, with batch correct counts available to be used in graphing pages
- Integration utility tool
- New cell classification tool, ScType, with the ability to customize marker genes
- Confidence score annotations for cell type classification tools
- Project action recording on the current project page
- Data export options—for R / Seurat, Scanpy (H5AD), Muon (H5MU), FCS and CSV
- RNA data import option—Seurat RDS
- New DESeq2 method in the Differential Analysis tool
- "Selected Cell Actions" menu on graphing pages, and added "Delete Cells" and "Quick Differential Analysis" options
- Switch to reverse color palette
- Contour lines overlay to biaxial plot
- Options to start project, including flavor of highly variable gene selection, number of highly variable genes and number of PCA/LSI components
- Ability to filter bioproduct dropdown by modality
- Ability to Export and restore app settings
- Support for BD Rhapsody™ ATAC-Seq Assay
系统需求
Windows 10或更高版本(64位)
MacOS 14(Sonoma)或更高版本(Intel或Apple Silicon芯片
最低8 GB RAM
RNA/AbSeq
200,000细胞时需要16 GB RAM
1M细胞时需要64 GB RAM
仅ATAC或ATAC多组学
100,000细胞时需要16 GB RAM
500,000细胞时需要64 GB RAM
----
当前版本:v3.0 | 发布日期:2026年9月
新增功能
支持 BD Rhapsody™ TCR/BCR Next 多组学
新增AIRR分析模态,兼容符合AIRR标准的重排TSV文件与仅VDJ 数据集
支持多组TCR/BCR数据集的合并与分析
支持修改分析流程(BD pipeline)默认提供的细胞类型注释,以指定用于TCR/BCR分析的细胞
支持自定义克隆型与克隆扩增注释分类
支持查看克隆型大小分布与丰度图
通过可检索表格、交互式蜂窝图与柱状图探索克隆型;支持按细胞注释或基因表达量着色,并筛选排名靠前的克隆型
在整个软件中,可将克隆型定义作为细胞注释,例如:
- 跨克隆型开展差异表达分析
- 通过热图、直方图与小提琴图对比不同克隆型之间的基因表达差异
- 在降维图上展示特定克隆型
查看同一克隆型下contig的核苷酸/氨基酸序列多序列比对结果,并支持FASTA格式导出
支持在不同分类注释之间,比较克隆型重叠度,优势克隆/选定克隆的频率变化
支持在不同的分类注释之间,比较免疫组库的多样性、丰富度与优势克隆占比
支持查看单个与联合基因片段使用情况,包括配对链的使用信息
支持查看CDR3长度分布与序列基序特征
支持B细胞谱系示踪分析
整体质量控制:新增ATAC数据的峰内转座酶位点占比、TSS富集分数与核小体信号得分等质控指标
更新内容
更新最终用户许可协议
问题修复
双细胞检测:修复重新运行后细胞误删问题
双轴图:修复在已有细胞注释内新建注释分类时出现的界面卡死问题
双轴图:修复未打开项目时选择坐标轴触发的界面死问题








获取关于BD Cellismo™ Tool新功能的逐步演示,包括支持BD Rhapsody™ ATAC-Seq试剂盒、批量校正、双重细胞检测和使用新的ScType算法进行细胞分类。
获取关于BD Cellismo™ Tool功能的逐步演示,这是一个旨在帮助您轻松可视化多组学单细胞数据的全新软件工具。
了解如何将单细胞数据导入该工具。可直接拖拽并放入.cellismo、.h5mu、.h5ad或mex格式的文件。探索来自PBMC的演示数据,包括2,500个细胞、30个蛋白质和2,500个基因。
了解如何使用BD Cellismo™ Tool的套索选择工具,根据蛋白表达选择细胞。可探索显示CD3、CD4和CD45RA表达的双轴图。选择CD4 T细胞,创建新的标注,并识别CD4初始T细胞和记忆T细胞。
了解该工具中可用于数据探索的七种图形类型。使用t-SNE和UMAP进行降维。可通过调整点大小、不透明度和调色板来自定义图形。将绘图保存为SVG或PNG格式,或添加到图库中。在分析结束时,将所有图形导出为PNG格式。
了解如何使用BD Cellismo™ Tool在单细胞分析中执行质量控制。可调整滑动条来设置元数据,如线粒体百分比、每个细胞的分子数及每个细胞的生物产物数等。设置阈值,标记不需要的细胞,并应用筛选器以优化数据集。
探索BD Cellismo™ Tool的细胞类型标注功能。使用内置的CellTypist算法及人类和小鼠参考数据集。将标注结果导出为CSV文件,用于下游分析。支持基于蛋白、RNA或组合模式创建新的聚类。
了解如何使用该工具执行差异表达分析。可分析蛋白或RNA模式,选择感兴趣的细胞,并在交互式火山图中查看结果。可调整显著性水平,突出显示基因,并在降维图上探索表达情况。
为基因或蛋白构建生物产物集,包括针对PBMC细胞类型的默认集合。在热图中可视化CD45RA、CD4和CD3等标志物的联合表达。使用实用工具计算新的降维坐标。
免费,但功能强大——立即体验
立即下载免费的BD Cellismo™ Data Visualization Tool。填写信息并点击提交后,系统将自动开始下载。我们将通过您提供的信息,为您推送产品的最新进展、更新和漏洞修复内容。
Windows用户:
文件下载完成后,双击.exe文件。安装过程中将显示进度动画。安装完成后程序将自动启动,并在桌面创建快捷方式。
Mac用户:
提供两种不同的安装包,您可根据您的芯片类型进行选择-Mac(Intel)或Mac(Apple M)。您可以通过以下步骤查看您的芯片类型:点击左上角的“Apple”菜单。 选择“关于本机”,在“芯片”一栏中,将显示“Intel”或“Apple”。在下面的表格中,选择适合您的系统的选项。文件下载完成后,双击.zip文件以解压出Cellismo.app。双击Cellismo.app打开。您可以将应用程序移动到您选择的文件夹中(例如,用户的“应用程序”目录)。
安装完成后,在“主页”的“ 开始新项目 ”选项卡下创建新项目。将数据文件拖放到页面并点击“ 开始分析.”即可开始使用。
下载免费的BD Cellismo™工具
填写您的信息并点击“提交”按钮后,将自动开始下载。
*Required fields
仅供研究使用。不用于诊断或治疗程序。
Apple和Mac是Apple, Inc.的商标。Illumina是Illumina, Inc.的商标。Intel是Intel Corporation或其子公司的商标。