The site is undergoing maintenance on
Friday, September 11, 2026, 12:00 - 8:00 am (HKT).
If you encounter problems while ordering, please contact us at BDBCustomerService@bd.com
See More
The site is undergoing maintenance on
Friday, September 11, 2026, 12:00 - 8:00 am (HKT).
If you encounter problems while ordering, please contact us at BDBCustomerService@bd.com
See MoreThe site is undergoing maintenance on
Friday, September 11, 2026, 12:00 - 8:00 am (HKT)
.If you encounter problems while ordering, please contact us at BDBCustomerService@bd.com
Looks like you're visiting us from {countryName}.
Would you like to stay on the current location or be switched to your location?
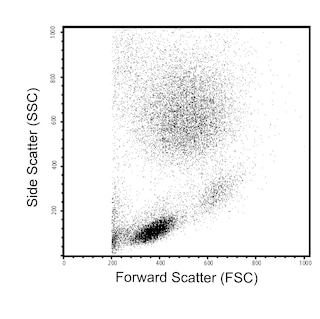
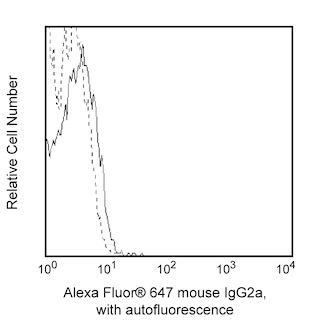
Multiparameter flow cytometric analysis of CD3 expression on human peripheral blood leucocytes. Whole blood was stained with either Alexa Fluor® 647 Mouse IgG2a, κ Isotype Control (Cat. No. 557715; Left Plot) or Alexa Fluor® 647 Mouse Anti-Human CD3 antibody (Cat. No. 566334; Right Plot) at 0.25 µg/test. Erythrocytes were lysed with BD Pharm Lyse™ Lysing Buffer (Cat. No. 555899). Two-parameter dot plots showing the correlated expression of CD3 (or Ig Isotype control staining) versus side light-scatter (SSC-A) signals were derived from gated events with the forward and side light-scatter characteristics of viable leucocyte populations. Flow cytometric analysis was performed using a BD™ LSR II Flow Cytometer System. Data shown on this Technical Data Sheet are not lot specific.
未经BD明确书面授权,严禁使用未经许可的任何商品。
The human CD3 complex consists of four transmembrane proteins (γ, δ, ε, ζ) that are associated with the T cell antigen receptor (TCR) to form the CD3/TCR complex. The CD3 complex associates with either TCR αβ or TCR γδ heterodimers that are expressed by some thymocytes, T cells or NKT cells. The CD3 complex is required for the cell surface expression and signal-transducing functions of the TCR. The CD3 complex is expressed by ~60-85% thymocytes and ~60-80% of normal human peripheral blood lymphocytes. The MEM-57 monoclonal antibody reportedly recognizes the human CD3 epsilon subunit (CD3e/CD3ε, also known as T3E or TCRE) of the CD3/TCR complex. CD3e is a ~20 kDa unglycosylated transmembrane protein that belongs to the Ig gene superfamily. CD3e has an Ig-like extracellular domain (ECD) and an immunoreceptor tyrosine-based activation motif (ITAM) in its cytoplasmic domain. The MEM-57 antibody reportedly stimulates T cell proliferation and can induce cytotoxicity in some human T cell lines.
Please refer to Support Documents for Quality Certificates
Global - Refer to manufacturer's instructions for use and related User Manuals and Technical data sheets before using this products as described
Comparisons, where applicable, are made against older BD Technology, manual methods or are general performance claims. Comparisons are not made against non-BD technologies, unless otherwise noted.
For Research Use Only. Not for use in diagnostic or therapeutic procedures.