Dear Customer, If you experience any text readability or display issues on our website, please update your web browser to the latest version
.
See More
Dear Customer, If you experience any text readability or display issues on our website, please update your web browser to the latest version
.
See MoreDear Customer, If you experience any text readability or display issues on our website, please update your web browser to the latest version
.
This page has been recently translated and is available in French now.
Looks like you're visiting us from {countryName}.
Would you like to stay on the current location site or be switched to your location?
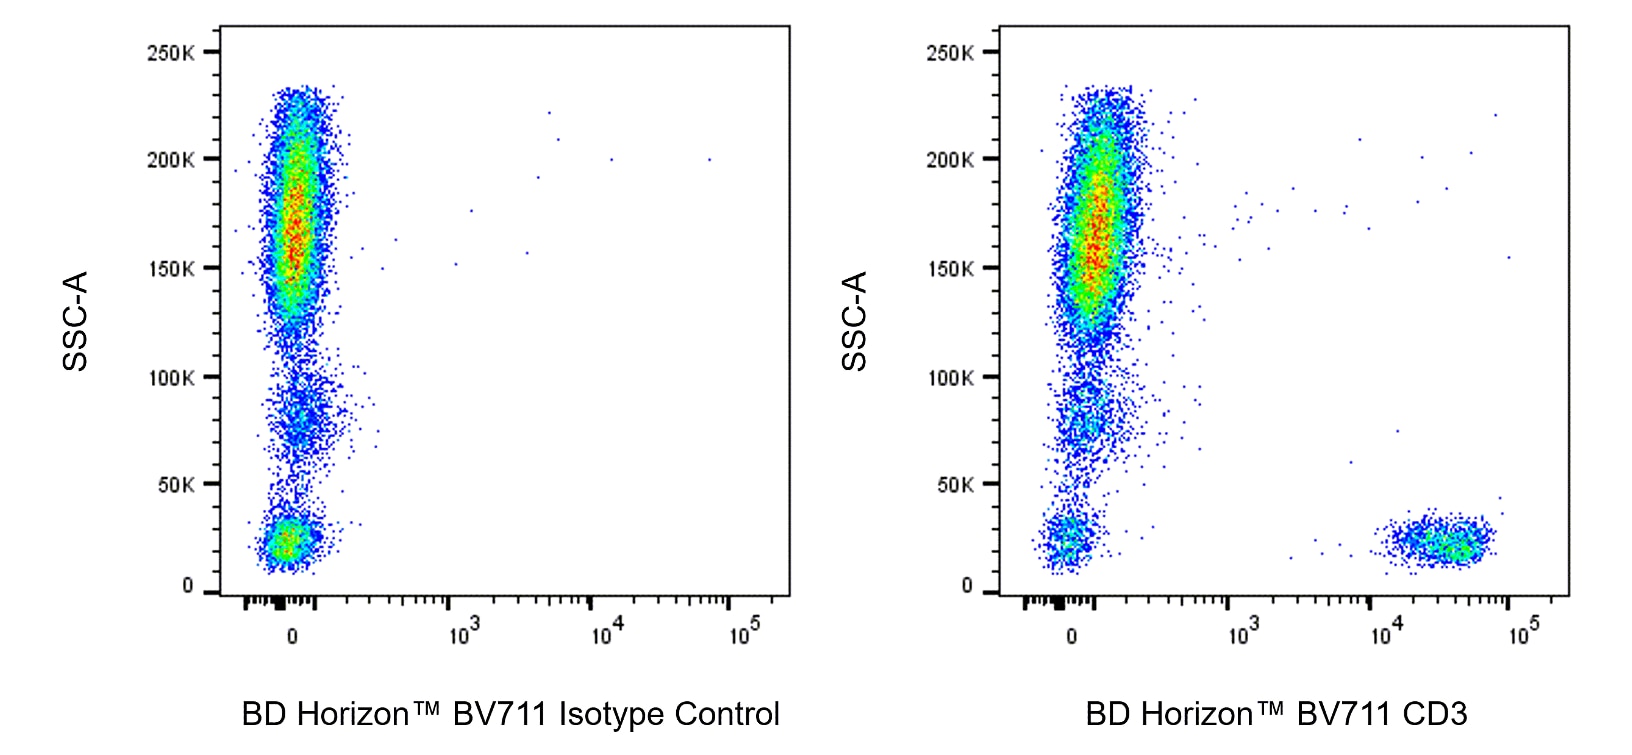
Multiparameter flow cytometric analysis of CD3 expression on Human peripheral blood leukocyte populations. Human whole blood was stained with either BD Horizon™ BV711 Mouse IgG1, κ Isotype Control (Cat. No. 563044; Left Plot) or BD Horizon™ BV711 Mouse Anti-Human CD3 antibody (Cat. No. 569787; Right Plot) at 0.5 µg/test. Erythrocytes were lysed with BD FACS™ Lysing Solution (Cat. No. 349202). The bivariate pseudocolor density plot showing the correlated expression of CD3 (or Ig Isotype control staining) versus side light-scatter (SSC-A) signals was derived from gated events with the forward and side-light scatter characteristics of intact leukocytes. Flow cytometry and data analysis were performed using a BD LSRFortessa™ X-20 Cell Analyzer System and FlowJo™ software. Data shown on this Technical Data Sheet are not lot specific.
Any use of products other than the permitted use without the express written authorization of Becton, Dickinson and Company is strictly prohibited.
BD® CompBeads can be used as surrogates to assess fluorescence spillover (compensation). When fluorochrome conjugated antibodies are bound to BD® CompBeads, they have spectral properties very similar to cells. However, for some fluorochromes there can be small differences in spectral emissions compared to cells, resulting in spillover values that differ when compared to biological controls. It is strongly recommended that when using a reagent for the first time, users compare the spillover on cells and BD® CompBeads to ensure that BD® CompBeads are appropriate for your specific cellular application.
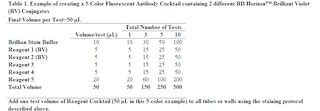
For optimal and reproducible results, BD Horizon Brilliant™ Stain Buffer should be used anytime BD Horizon Brilliant™ dyes are used in a multicolor flow cytometry panel. Fluorescent dye interactions may cause staining artifacts which may affect data interpretation. The BD Horizon Brilliant Stain Buffer was designed to minimize these interactions. When BD Horizon Brilliant Stain Buffer is used in in the multicolor panel, it should also be used in the corresponding compensation controls for all dyes to achieve the most accurate compensation. For the most accurate compensation, compensation controls created with either cells or beads should be exposed to BD Horizon Brilliant Stain Buffer for the same length of time as the corresponding multicolor panel. More information can be found in the Technical Data Sheet of the BD Horizon Brilliant Stain Buffer (Cat. No. 563794/566349) or the BD Horizon Brilliant Stain Buffer Plus (Cat. No. 566385).
The SK7 (Leu-4) monoclonal antibody specifically binds to the epsilon chain of the CD3 antigen/T-cell antigen receptor (TCR) complex. This complex is composed of at least six proteins that range in molecular weight from 20 to 30 kDa. The antigen recognized by CD3 antibodies is noncovalently associated with either α/β or γ/δ TCR (70 to 90 kDa). The CD3 antigen is present on 61% to 85% of normal peripheral blood lymphocytes 60% to 85% of thymocytes and on Purkinje cells in the cerebellum. The soluble form of this antibody has a mitogenic effect on most peripheral blood T lymphocytes, provided appropriate functional monocytes are present.
Please refer to Support Documents for Quality Certificates
Global - Refer to manufacturer's instructions for use and related User Manuals and Technical data sheets before using this products as described
Comparisons, where applicable, are made against older BD Technology, manual methods or are general performance claims. Comparisons are not made against non-BD technologies, unless otherwise noted.
For Research Use Only. Not for use in diagnostic or therapeutic procedures.