BD CellView™ Image Technology is real-time imaging (RTI) technology that combines flow cytometry data with spatial and morphological insights. The technology enables answering complex biological questions quickly, such as how cells grow, function and interact, or studying locations of viruses or proteins within a cell. The technology seamlessly integrates image and flow data on each event and can easily visualize the image for an event during acquisition. It enhances fluorescence activated cell sorting (FACS) with live visual inspection of target cells and novel gating strategies based on real-time image feature analysis using spatial distribution of fluorescence capabilities.
BD CellView™ Image Technology versus camera-based imaging cytometry
In contrast to camera-based technologies that combine imaging and flow cytometry, BD CellView™ Image Technology does not use a camera to image cells, which enables imaging at much faster rates. Camera-based technologies are limited by closely controlled fluidics and cannot be used for high-speed droplet cell sorting. BD CellView™ Image Technology implements orthogonal frequency domain multiplexing (OFDM) for imaging cells using electronic and optical components already used in flow cytometers. This method allows faster throughput than camera-based technologies. The image data can be acquired and quantified in real time at high speed for analysis and sorting as the sample is being acquired.
Principles of BD CellView™ Image Technology

Eccentricity
Eccentricity is a ratio of the shortest to the longest axis of the identified particle (as identified by the region of analysis)
Usage examples: Doublet discrimination, cluster identification
Availability: All imaging channels

Max Intensity
Max intensity is the intensity of the brightest pixel in the image. It is not affected by the region of analysis.
Usage examples: Punctate fluorescence, phagocytosis assay, cell cycle analysis
Availability: All imaging channels

Size
Size is the number of pixels in the image, which are brighter than a user-defined pixel threshold.
Usage examples: Label-free sorting, punctate fluorescence
Availability: All imaging channels

Radial Moment
Radial moment is the average distance of the pixels from the centroid within the region of analysis.
Usage examples: Doublet discrimination (with Eccentricity), cell—cell interactions (cellular synapse)
Availability: All imaging channels

Correlation
Correlation is the degree to which the location of two imaging channels are the same within the region of pixels defined by the region of analysis.
Usage example: Translocation assay
Availability: Any two imaging fluorescence channels

Delta Center of Mass
The distance between two fluorescent signal sources in any two imaging channels within a particle as defined by the region of analysis.
Availability: Any two imaging channels

Forward Scatter (FSC)
As particles (cells) pass through the laser, the interaction of the light with the particle results in scatter in all directions.
The forward scatter detector is placed in line with the laser path to measure light that is scattered at small angles. forward scatter loosely correlates to particle (cell) size.
")
Side Scatter (SSC)
As particles (cells) pass through the laser, the interaction of the light with the particle results in scatter in all directions.
The side scatter detector measures light that is scattered perpendicular (90°) to the laser path. Side scatter loosely correlates to optical density or complexity of the particle.
")
Light Loss (Imaging)
As particles (cells) pass through the laser, the interaction of the light with the particle results in scatter in all directions.
Light loss is a measure of light (photons) lost from the laser due to scattering and absorption of light by a particle (cell).
")
Using Image Features to Measure the Relative Location of Fluorescence Signals and Track Morphological Changes in Cell Populations
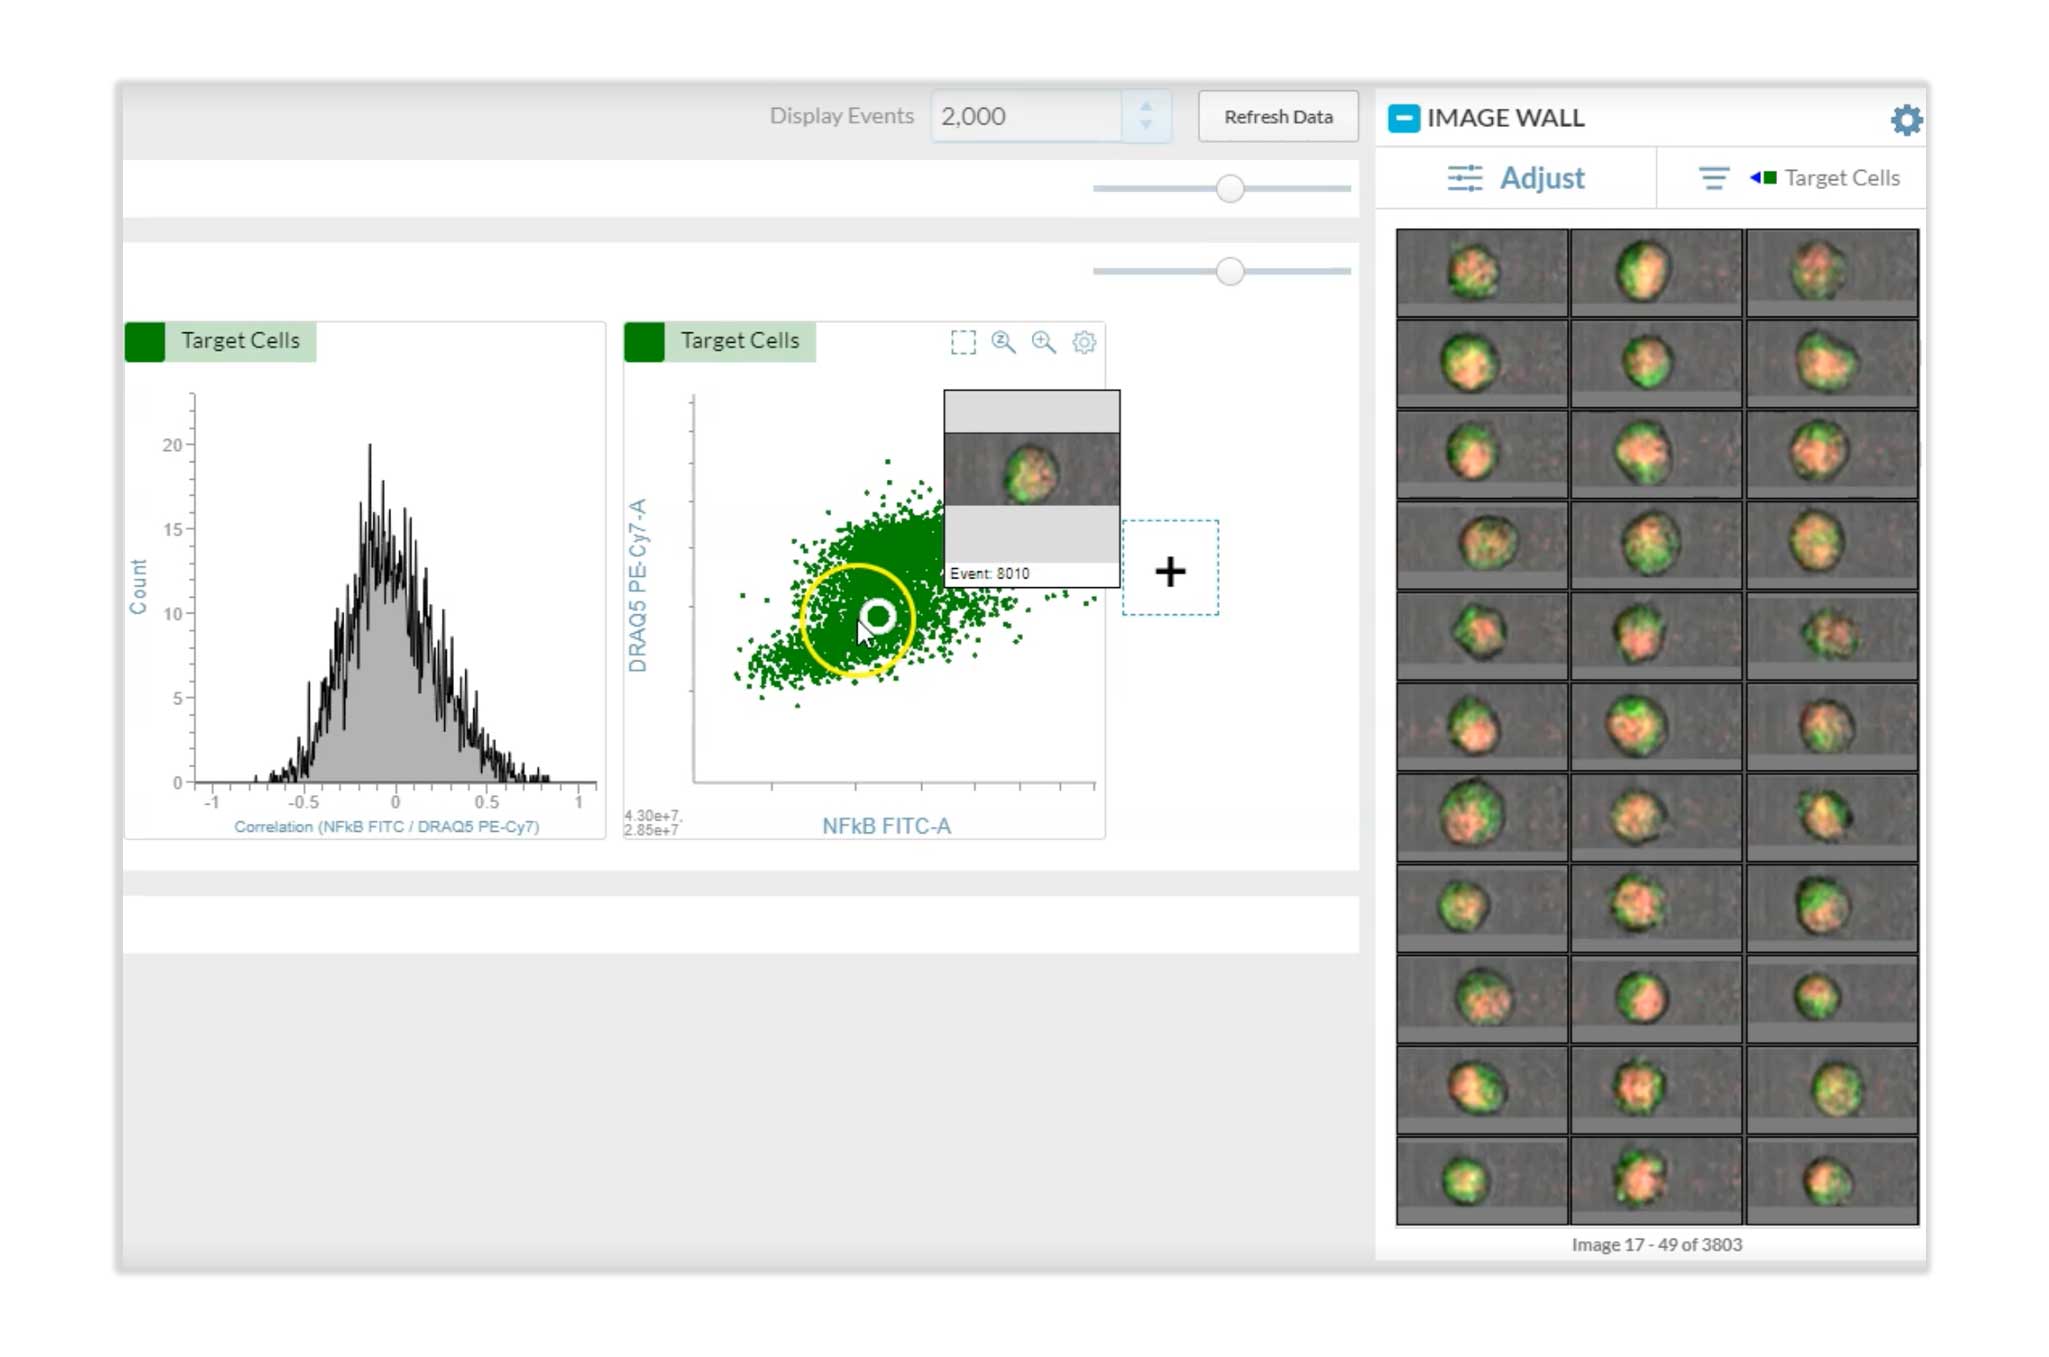
HT-1080 fibrosarcoma cells were treated with TNF-a and then subsequently fixed, permeabilized and stained for p65 (NFκB) using a secondary FITC-labeled antibody. The cells were then counterstained with the DNA stain DRAQ5™. BD CellView™ Image Technology enables the measurement of the relative spatial correlation between the NFκB FITC signal and the DNA DRAQ5™ signal. A correlation score of 1 indicates that both signals occupy the same space spatially.
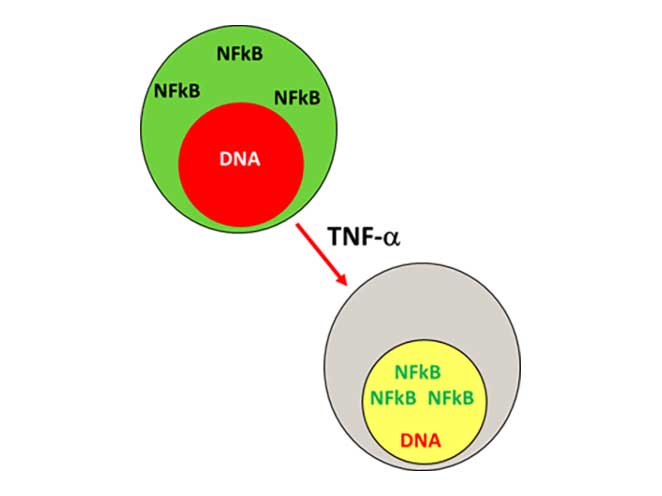
Real-time image feature analysis measures the spatial correlation between two fluorescent signals.
-DNA-Thumbnail.jpg)
TNF-a titration of HT-1080 fibrosarcoma cells demonstrates varying degrees of translocation. The correlation score measures the relative degree of translocation.
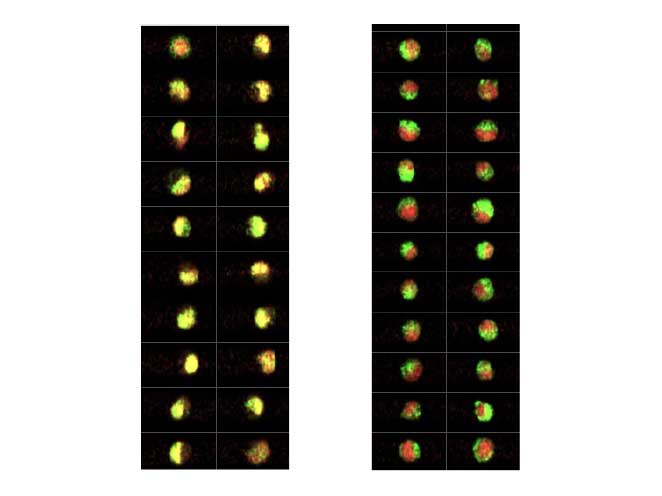
Increasing concentrations of TNF-a induce translocation of NFκB from the cytoplasm into the nucleus. The green fluorescence signal of NFκB and the red fluorescence signal of the DNA merge to appear yellow.
Doublet Discrimination Using Imaging Features to Bolster Purity
Doublet and clump exclusion is a critical preliminary step in establishing a pure sort. Doublets can confound purity and can lead to unwanted results or unnecessary expense when performing downstream functional and/or genomic analyses. Here we sought to demonstrate the improvements in doublet discrimination that an image enabled sorter can offer. Peripheral blood mononuclear cells (PBMCs) were prepared by Ficoll™ separation from five healthy donors. Sample preparations were counterstained with DRAQ5™, a membrane permeable, DNA intercalating dye that is compatible with BD CellView™ Image Technology. Doublet frequency was tracked via DNA content as traditional scatter-based doublet discrimination strategies were compared with an image-based approach. Singlet vs non-singlet (doublets and clumps) content in each gate was compared.
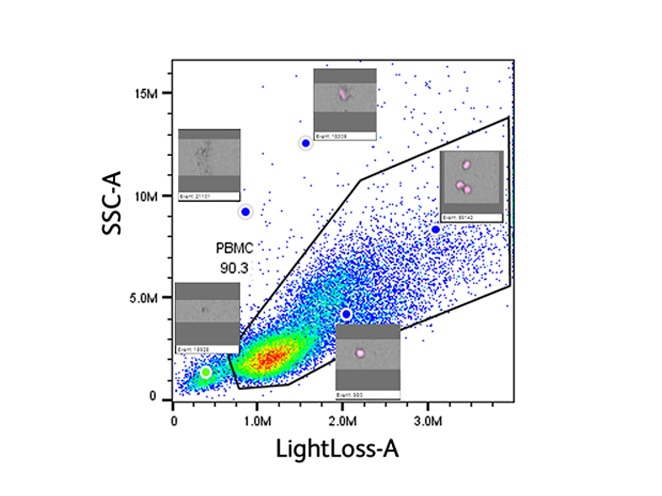
BD CellView™ Image Technology generated image features can be used to identify and exclude doublets. The mouse-over function enables accurate gate placement.
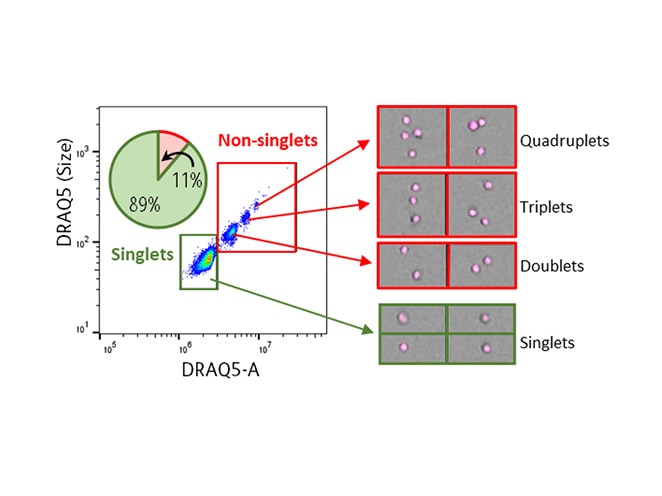
DRAQ5™ DNA dye is used to track the singlet vs non-singlet content inside and outside of each gate defined during the doublet exclusion workflow.
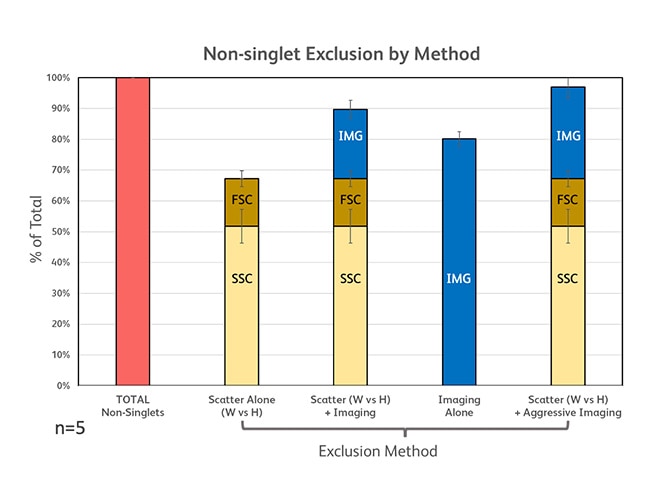
The percentage of doublets excluded, and the percentage of singlets preserved is compared across several doublet exclusion strategies.
Identifying all stages of cell cycle using imaging features
Each of the five stages of mitosis—interphase, prometaphase, metaphase, anaphase and telophase—are characterized by a particular chromosomal morphology and/or cell shape that can be used to separate these stages.
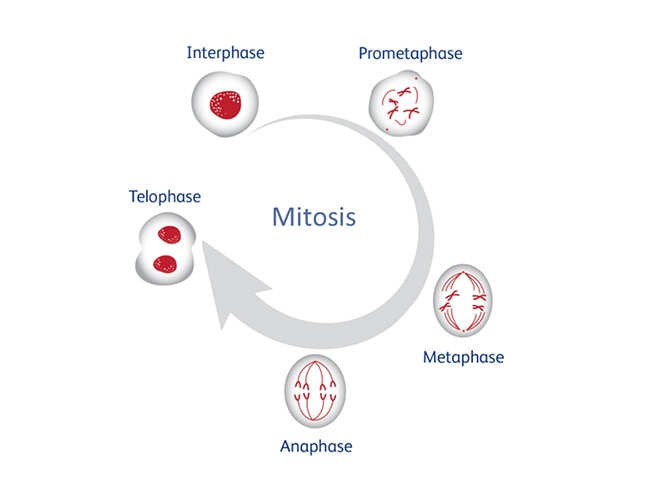
HeLa cells expressing neon green histone H2B were used to evaluate each of the five phases of mitosis.

Fluorescence (Area) parameters were coupled with several image features to establish a gating strategy to identify cells at interphase, prometaphase and metaphase.

HeLa cells at anaphase and telophase were identified using a combination of fluorescence (Area) parameters and image features.
Measuring translocation:
HeLa cells expressing fluorescently tagged NFκB with DRAQ5™ DNA counterstain

Combining BD SpectralFX™ Technology and BD CellView™ Image Technology
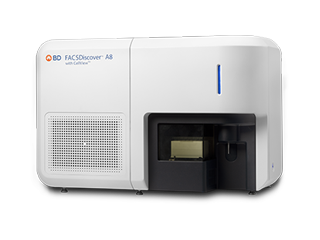
The BD FACSDiscover™ A8 Cell Analyzer and BD FACSDiscover™ S8 Cell Sorter combine spectral flow cytometry with real-time imaging technology to uncover new insights in your discovery.
The BD FACSDiscover™ A8 Cell Analyzer:
- Provides insights on cell populations and characteristics that can be visually confirmed in real time during analysis
- Integrated autoloader with temperature control and sample mixing
- Enhances spectral flow cytometry with spatial and morphological insights to analyze cell types that previously could not be identified or isolated
- Simplifies workflow with built-in visual inspection capabilities, more flexible panel design and automated features
- Flexibility to use imaging or high-speed mode
- Enables comprehensive profiling of highly complex biology and downstream analysis with real-time imaging and traditional flow data
The BD FACSDiscover™ S8 Cell Sorter:
- Provides insights on cell populations and characteristics that can be visually confirmed in real time during analysis and sorting
- Enhances spectral flow cytometry with spatial and morphological insights to interrogate and sort cell types that previously could not be identified or isolated
- Simplifies workflow with built-in visual inspection capabilities, more flexible panel design and automated features
- Enables comprehensive profiling of highly complex biology and downstream analysis with real-time imaging and traditional flow data
This how-to video provides a detailed walkthrough and practical tips on setting the region of analysis (ROA) and adjusting the pixel threshold using the BD FACSDiscover™ S8 Cell Sorter with BD CellView™ Image Technology. The video demonstrates how to adjust gains and select imaging features, using various sample controls to enhance side scatter signals and fluorescence markers.
This how-to video provides a detailed guide on adjusting image wall settings to enhance the visualization of cell samples using the BD FACSDiscover™ S8 Cell Sorter with BD CellView™ Image Technology. Techniques such as adjusting gamma to reduce background noise, selecting appropriate color channels for different stains, and managing light loss to improve image clarity are discussed. The video also explores the use of histograms to analyze the distribution of fluorescence in cell populations, helping you understand how to effectively present multiple color fluorescence without overwhelming the visual field.
Request Quote / General Inquiry
If you have questions related to a product or application, or would like to request samples, a quote or demo, please submit your inquiry.
*Required fields
For Research Use Only. Not for use in diagnostic or therapeutic procedures. CF is a trademark of Biotium, Inc.
Class 1 Laser Products.