





BD Horizon™ BV605 Mouse Anti-Human CD39
Clone A1 (also known as A1/CD39) (RUO)


Flow cytometric analysis of CD39 expression on human peripheral blood leucocyte populations.
Upper Plots: Whole blood was stained with either BD Horizon™ BV605 Mouse IgG1, κ Isotype Control (Cat No. 562652; Left Plot) or BD Horizon™ BV605 Mouse Anti-Human CD39 antibody (Cat No. 567691/567692; Right Plot). Erythrocytes were lysed with BD FACS™ Lysing Solution (Cat No. 349202). A bivariate pseudocolor density plot showing the correlated expression of CD39 (or Ig Isotype control staining) versus side light-scatter signals (SSC-A) was derived from gated events with the forward and side light-scatter characteristics of intact leucocyte populations.
Lower Plots: Human peripheral blood mononuclear cells (PBMC) were preincubated with BD Pharmingen™ Human BD Fc Block™ (Cat. No. 564219/564220) and then stained with BD Horizon™ BUV395 Mouse Anti-Human CD4 (Cat. No. 564724), FITC Mouse Anti-Human CD25 (Cat. No. 555431/560990), BD Horizon™ BUV737 Mouse Anti-Human CD127 (Cat No. 612794/612795) antibodies, and either BD Horizon™ BV605 Mouse IgG1, κ Isotype Control (dashed line histogram) or BD Horizon™ BV605 Mouse Anti-Human CD39 antibody (solid line histogram). DAPI (4',6-Diamidino-2-Phenylindole, Dihydrochloride) Solution (Cat. No. 564907) was added to cells right before analysis. The bivariate pseudocolor density plot showing the coexpressed levels of CD25 versus CD127 by viable (DAPI-negative) light scatter-gated CD4+ T cells [Left Plot] was further gated to reveal CD39 expression (or Ig Isotype control staining) [Right Plot] on CD4+CD25+CD127low T cells (ie, cells with a Regulatory T cell immunophenotype) as shown.
Flow cytometric analysis was performed using a BD LSRFortessa™ X-20 Flow Cytometer System and FlowJo™ software.
Flow cytometric analysis of CD39 expression on human peripheral blood leucocyte populations.
Upper Plots: Whole blood was stained with either BD Horizon™ BV605 Mouse IgG1, κ Isotype Control (Cat No. 562652; Left Plot) or BD Horizon™ BV605 Mouse Anti-Human CD39 antibody (Cat No. 567691/567692; Right Plot). Erythrocytes were lysed with BD FACS™ Lysing Solution (Cat No. 349202). A bivariate pseudocolor density plot showing the correlated expression of CD39 (or Ig Isotype control staining) versus side light-scatter signals (SSC-A) was derived from gated events with the forward and side light-scatter characteristics of intact leucocyte populations.
Lower Plots: Human peripheral blood mononuclear cells (PBMC) were preincubated with BD Pharmingen™ Human BD Fc Block™ (Cat. No. 564219/564220) and then stained with BD Horizon™ BUV395 Mouse Anti-Human CD4 (Cat. No. 564724), FITC Mouse Anti-Human CD25 (Cat. No. 555431/560990), BD Horizon™ BUV737 Mouse Anti-Human CD127 (Cat No. 612794/612795) antibodies, and either BD Horizon™ BV605 Mouse IgG1, κ Isotype Control (dashed line histogram) or BD Horizon™ BV605 Mouse Anti-Human CD39 antibody (solid line histogram). DAPI (4',6-Diamidino-2-Phenylindole, Dihydrochloride) Solution (Cat. No. 564907) was added to cells right before analysis. The bivariate pseudocolor density plot showing the coexpressed levels of CD25 versus CD127 by viable (DAPI-negative) light scatter-gated CD4+ T cells [Left Plot] was further gated to reveal CD39 expression (or Ig Isotype control staining) [Right Plot] on CD4+CD25+CD127low T cells (ie, cells with a Regulatory T cell immunophenotype) as shown.
Flow cytometric analysis was performed using a BD LSRFortessa™ X-20 Flow Cytometer System and FlowJo™ software.


Preparation And Storage


Recommended Assay Procedures
BD® CompBeads can be used as surrogates to assess fluorescence spillover (Compensation). When fluorochrome conjugated antibodies are bound to CompBeads, they have spectral properties very similar to cells. However, for some fluorochromes there can be small differences in spectral emissions compared to cells, resulting in spillover values that differ when compared to biological controls. It is strongly recommended that when using a reagent for the first time, users compare the spillover on cells and CompBead to ensure that BD® CompBeads are appropriate for your specific cellular application.
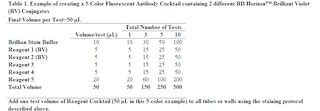
For optimal and reproducible results, BD Horizon Brilliant™ Stain Buffer should be used anytime BD Horizon Brilliant™ dyes are used in a multicolor flow cytometry panel. Fluorescent dye interactions may cause staining artifacts which may affect data interpretation. The BD Horizon Brilliant™ Stain Buffer was designed to minimize these interactions. When BD Horizon Brilliant™ Stain Buffer is used in in the multicolor panel, it should also be used in the corresponding compensation controls for all dyes to achieve the most accurate compensation. For the most accurate compensation, compensation controls created with either cells or beads should be exposed to BD Horizon Brilliant™ Stain Buffer for the same length of time as the corresponding multicolor panel. More information can be found in the Technical Data Sheet of the BD Horizon Brilliant™ Stain Buffer (Cat. No. 563794/566349) or the BD Horizon Brilliant™ Stain Buffer Plus (Cat. No. 566385).
Product Notices
- This reagent has been pre-diluted for use at the recommended Volume per Test. We typically use 1 × 10^6 cells in a 100-µl experimental sample (a test).
- An isotype control should be used at the same concentration as the antibody of interest.
- Caution: Sodium azide yields highly toxic hydrazoic acid under acidic conditions. Dilute azide compounds in running water before discarding to avoid accumulation of potentially explosive deposits in plumbing.
- Please refer to www.bdbiosciences.com/us/s/resources for technical protocols.
- Please observe the following precautions: Absorption of visible light can significantly alter the energy transfer occurring in any tandem fluorochrome conjugate; therefore, we recommend that special precautions be taken (such as wrapping vials, tubes, or racks in aluminum foil) to prevent exposure of conjugated reagents, including cells stained with those reagents, to room illumination.
- For fluorochrome spectra and suitable instrument settings, please refer to our Multicolor Flow Cytometry web page at www.bdbiosciences.com/colors.
- CF™ is a trademark of Biotium, Inc.
- BD Horizon Brilliant Violet 605 is covered by one or more of the following US patents: 8,110,673; 8,158,444; 8,227,187; 8,455,613; 8,575,303; 8,354,239.
- BD Horizon Brilliant Stain Buffer is covered by one or more of the following US patents: 8,110,673; 8,158,444; 8,575,303; 8,354,239.
- Please refer to http://regdocs.bd.com to access safety data sheets (SDS).
- Although every effort is made to minimize the lot-to-lot variation in the efficiency of the fluorochrome energy transfer, differences in the residual emission from BD Horizon™ BV421 may be observed. Therefore, we recommend that individual compensation controls be performed for every BD Horizon™ BV605 conjugate.
Companion Products



The A1 monoclonal antibody specifically recognizes human CD39 which is also known as Ecto-ATP diphosphohydrolase 1 (Ecto-ATPase 1 or Ecto-ATPDase 1), Ecto-apyrase or NTPDase 1. CD39 is a ~78 kDa integral membrane glycoprotein that is encoded by ENTPD1 (Ectonucleoside triphosphate diphosphohydrolase 1). CD39 contains two transmembrane domains, one having a N- and the other a C-terminal cytoplasmic tail, and a large extracellular domain that has the enzymatic site. CD39 is also known as Lymphoid cell activation antigen because its expression is induced upon activation of T and B cells. CD39 is variably expressed on some regulatory T cells, NK cells, granulocytes, monocytes, dendritic cells, Langerhans cells, endothelial cells, platelets, and neurons. CD39 is a member of the ectonucleoside triphosphate dihydrolases (E-NTPDases) family that is involved in the regulation of extracellular nucleotide catabolism by controlling the extracellular nucleoside triphosphate pool (NTP). It functions as an ectoenzyme that can hydrolyze both nucleoside triphosphates and diphosphates such as ATP and ADP and thereby suppress inflammation and regulate platelet activation as well as purinergic neurotransmission. The ectoenzymes CD39 and CD73 can act in tandem to enable regulatory T cells (Treg) to generate immunosuppressive adenosine and thereby regulate immune responses.
This antibody is conjugated to BD Horizon™ BV605 which is part of the BD Horizon Brilliant™ Violet family of dyes. With an Ex Max of 407-nm and Em Max of 602-nm, BD Horizon™ BV605 can be excited by a violet laser and detected with a standard 610/20-nm filter set. BD Horizon™ BV605 is a tandem fluorochrome of BD Horizon™ BV421 and an acceptor dye with an Em max at 605-nm. Due to the excitation of the acceptor dye by the green (532 nm) and yellow-green (561 nm) lasers, there will be significant spillover into the PE and BD Horizon™ PE-CF594 detectors off the green or yellow-green lasers. BD Horizon™ BV605 conjugates are very bright, often exhibiting brightness equivalent to PE conjugates and can be used as a third color off of the violet laser.

Development References (6)
-
Allard B, Longhi MS, Robson SC, Stagg J. The ectonucleotidases CD39 and CD73: Novel checkpoint inhibitor targets.. Immunol Rev. 2017; 276(1):121-144. (Biology). View Reference
-
Aversa GG, Suranyi MG, Waugh JA, Bishop AG, Hall BM. Detection of a late lymphocyte activation marker by A1, a new monoclonal antibody.. Transplant Proc. 1988; 20(1):49-52. (Immunogen: Flow cytometry). View Reference
-
Aversa GG, Waugh JA, Bishop GA, Hall BM. Use of monoclonal antibodies to study in vivo and in vitro-activated lymphocytes.. Transplant Proc. 1989; 21(1 Pt 1):349-50. (Clone-specific: Flow cytometry). View Reference
-
Gouttefangeas C, Mansur I, Bensussan A, Boumsell L. Biochemical analysis and epitope mapping of mAb defining CD39. In: Schlossman SF. Stuart F. Schlossman .. et al., ed. Leucocyte typing V : white cell differentiation antigens : proceedings of the fifth international workshop and conference held in Boston, USA, 3-7 November, 1993. Oxford: Oxford University Press; 1995:383-385.
-
Häusler SF, Del Barrio IM, Diessner J, et al. Anti-CD39 and anti-CD73 antibodies A1 and 7G2 improve targeted therapy in ovarian cancer by blocking adenosine-dependent immune evasion.. Am J Transl Res. 2014; 6(2):129-39. (Clone-specific: Flow cytometry, Functional assay, Inhibition). View Reference
-
Jones M, Mason DY. CD39 Workshop Panel report. In: Kishimoto T. Tadamitsu Kishimoto .. et al., ed. Leucocyte typing VI : white cell differentiation antigens : proceedings of the sixth international workshop and conference held in Kobe, Japan, 10-14 November 1996. New York: Garland Pub.; 1997:157-159.
Please refer to Support Documents for Quality Certificates
Global - Refer to manufacturer's instructions for use and related User Manuals and Technical data sheets before using this products as described
Comparisons, where applicable, are made against older BD Technology, manual methods or are general performance claims. Comparisons are not made against non-BD technologies, unless otherwise noted.
For Research Use Only. Not for use in diagnostic or therapeutic procedures.