
Flow cytometry and single-cell multiomics research solutions to support drug discovery, immunology and immuno-oncology research
When project deadlines are tight and competition is fierce, you need access to cutting-edge tools and expertise you can trust to provide you the competitive edge you need to be at the forefront of your research.
Built on over 45 years of flow cytometry expertise, our line of advanced research tools and services offer you complete cell analysis solutions to help enhance your experimental power and help accelerate your time to insight.
Go beyond your experimental limitations and explore with confidence.

We provide advanced tools to support a variety of research fields including immunology, immuno-oncology, cellular biology and genomics.
We proudly offer:
Robust Global Distribution
Leading-Edge Reagents, Instruments and Bioinformatics Software
Rigorous Quality Standards
Discover how our complete research solution can help you gain a better understanding of complex biological cellular systems
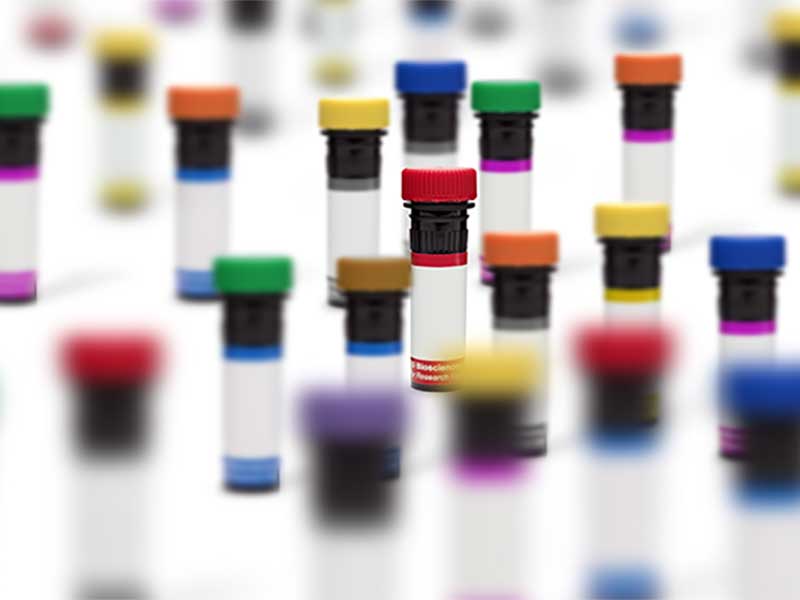
Trusted Research Reagents
Our high-quality and ever-growing line of antibody and fluorochrome conjugations, including BD Horizon Brilliant™ Ultraviolet Reagents, provide you confidence in your results and with the panel design flexibility you need.
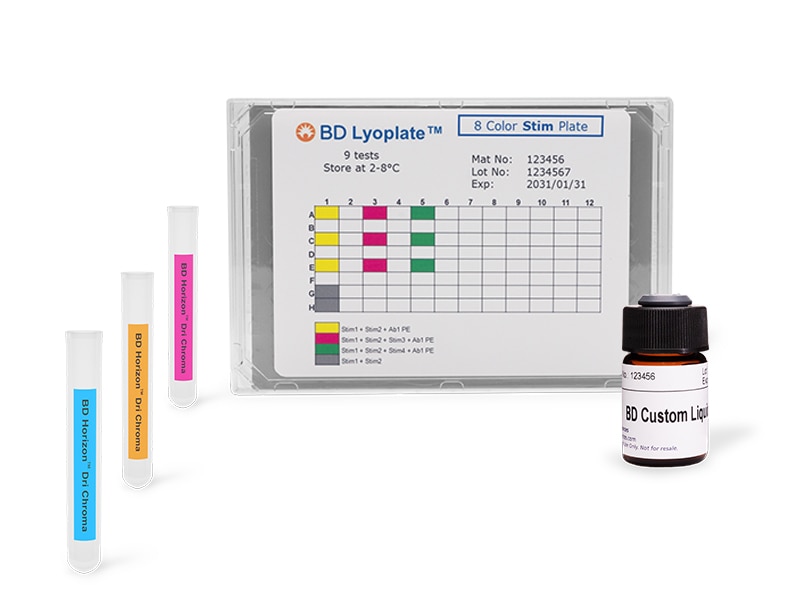
Custom Reagent Solutions
We offer best-in-class custom reagent products, including pre-aliquoted panels in various formats to provide you greater workflow flexibility and the lot-to-lot consistency you need. We also offer bulk custom and made-to-stock reagents to support your longitudinal studies. Additionally, we offer special order custom flow cytometry instrumentation to help meet your specific research requirements.
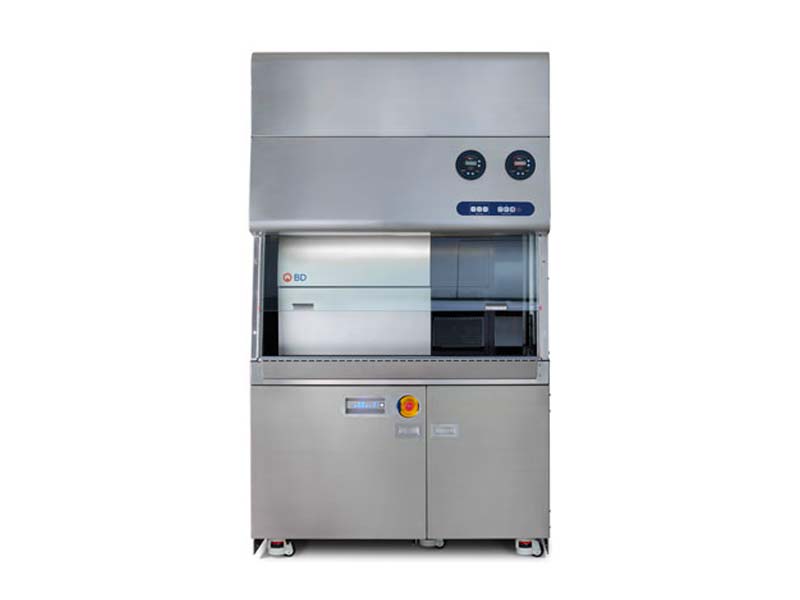
Cell Sorters
From simple cell sorting solutions to advanced solutions for high-parametric multicolor flow cytometry analysis, our cell sorters are powered by cutting-edge technology that allows sorting of cell populations with the complexity required for your applications. Discover a range of options for your research application, from simple, benchtop systems to advanced, fully configurable systems.
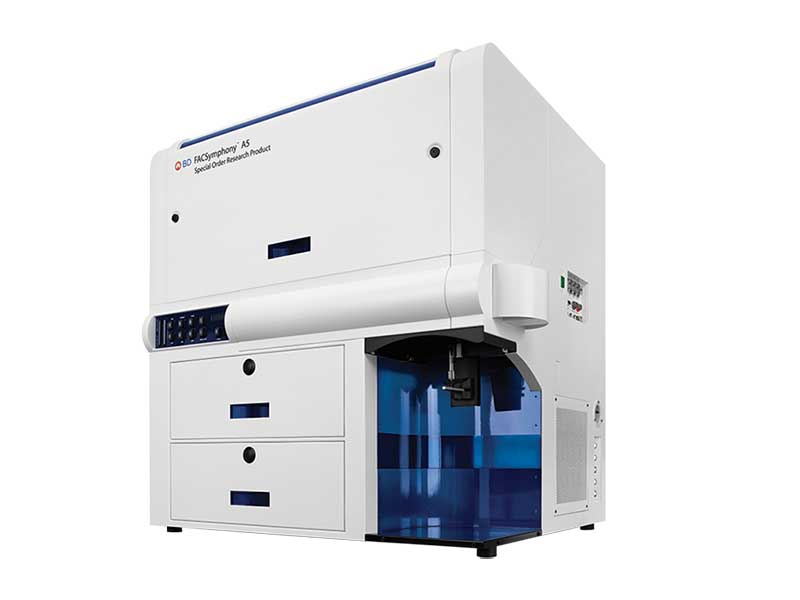
Analyzers
Ranging from single-parameter applications to high-dimensional cell analysis, the extensive portfolio of BD cell analyzers is designed to meet your research needs from simple, highly accessible personal flow cytometers to highly advanced, high-parameter cell analyzers. Explore our line of innovative, high-parameter flow cytometry instruments to learn how to accelerate scientific discovery and enable deeper scientific insights.
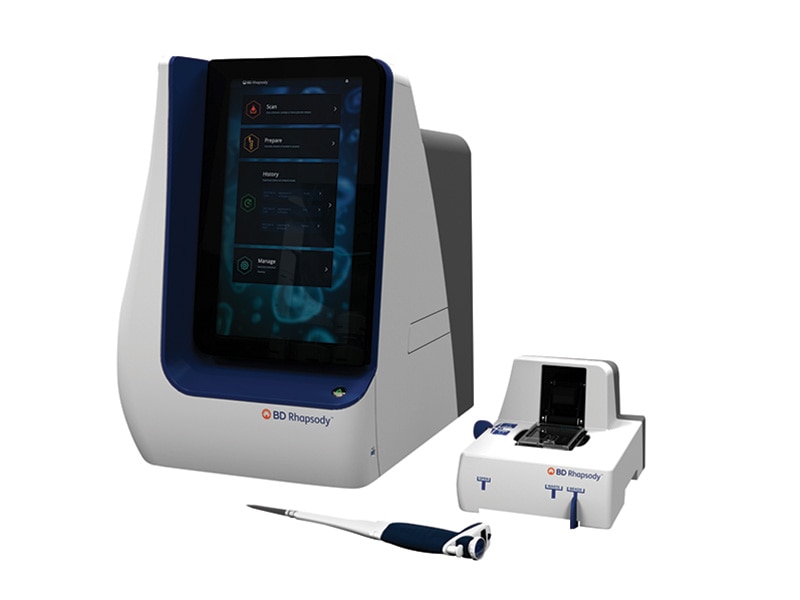
Single-Cell Multiomics Reagents and Instruments
Working seamlessly alongside the flow cytometry workflow, our single-cell multiomics solution includes sample prep instruments, RNA and protein reagents, protocols, bioinformatics tools and technical support to facilitate the analysis of hundreds of genes and proteins simultaneously at the single-cell level.
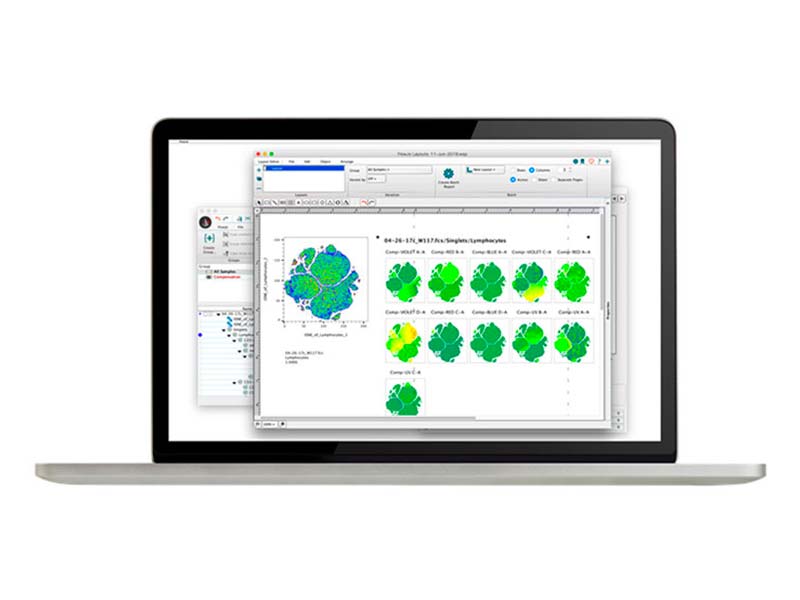
Bioinformatics Software
Stay ahead of the curve with FlowJo™ v10 Software—the leading platform* for your single-cell flow cytometry analysis.
*In 2020, FlowJo™ Software was cited in leading immunology peer-reviewed journals more often than any other flow cytometry analysis software.
Inquiry
If you have questions related to a product or application, or would like to request samples, a quote or demo, please submit your inquiry.
*Required fields