
Designing a High-Parameter Spectral Panel for Immune Cell Characterization and Separation
April 21, 2024
Recent advances in high-dimensional cell analysis have allowed scientists to garner more information from a sample than ever before. Cutting-edge technologies like spectral flow cytometry have been key in advancing the ever-evolving fields of immuno-oncology1 and cell and gene therapy.2 Continuous innovations in flow cytometry instrumentation, reagents and software have enabled researchers to dive more deeply into characterizing a cell population by measuring dozens of fluorochromes at once.
Spectral flow cytometry is a technique for high-dimensional cell analysis that measures the entire emission spectrum of individual fluorochromes. Many fluorochromes have near-identical peak emissions but can exhibit distinct off-peak emission patterns. By measuring the entire emission spectrum, spectral flow cytometry enhances the capacity to use many fluorochromes simultaneously by distinguishing the off-peak emission patterns.
Panel design for spectral flow cytometry
With the increase in instrument capabilities and the number of fluorochromes available, designing flow cytometry panels becomes more complex. Building a large panel involves developing an intricate gating strategy and careful consideration of reagents, instrumentation and software. Here, we provide a successful example using best practices to design a high-parameter spectral panel. The 33-color immunophenotyping panel we created characterizes T, B, NK and dendritic cell subpopulations in peripheral blood profiles through unbiased characterization on a multidimensional cell analysis platform (UMAP).
Understanding the instruments:
Before choosing fluorochromes, it’s important to understand the capabilities of the instruments. For example, what lasers and detectors are available? In the development of our 33-color panel, we used the BD FACSymphony™ A5 SE Cell Analyzer, which is equipped with five lasers and 48 fluorescence detectors.
Selecting markers:
Understanding expression and co-expression patterns of the markers in your cell population and the level of expression is key to selecting markers to identify populations of interest.
For optimal performance of a high parameter panel, consideration is given to several factors that can influence panel performance such as:
- Avoid using fluorochromes with high spectral overlap; if necessary, assign to markers that are not co-expressed
- Assign brighter fluorochromes to lowly expressed antigens and dimmer fluorochromes to highly expressed antigens to help manage spread and provide the necessary resolution.
Reviewing panel design in silico:
Before running your samples on a flow cytometer, it’s important to test out the panel design with software like our BD® Spectrum Viewer. This analysis can help you identify fluorochromes with highly overlapping emission spectra, optimize fluorochrome and filter selection and assess potential spillover. As instruments vary in terms of configuration and detector sensitivity, use a spectral viewer and panel building tools specific to your instrument’s configuration. This 33-color panel leverages our vast collection of single-fluorochrome antibodies to facilitate panel design.
A glimpse into the 33-color immunophenotyping panel. See the entire panel.
| Laser | Marker | Fluorochrome | Primary Assigned Detector | Catalog # | Clone | Compensation Control | Test Size (µL or µg / test) |
|---|---|---|---|---|---|---|---|
| UV | CD45RA | BUV395 | UV379 | 740315 | 5H9 | PBMCs | 0.06 µg |
| Auto F | Cells | UV446 | – | – | PBMCs | – | |
| CD45RO | BUV496 | UV515 | 74988 | UCHL1 | PBMCs | 0.5 µg | |
| CD16 | BUV563 | UV585 | 748851 | 3G8 | PBMCs | 0.5 µg | |
| CD185 / CXCR5 | BUV661 | UV660 | 741559 | RF8B2 | PBMCs | 0.06 µg | |
| CD28 | BUV737 | UV736 | 612815 | CD28.2 | PBMCs | 0.25 µg | |
| CD127 | BUV805 | UV809 | 748486 | HIL-7R-M21 | PBMCs | 0.5 µg | |
| Violet | CD25 | BV421 | V427 | 567485 | BC96 | PBMCs | 2.5 µL |
| CD20 | V450 | 450 | 561164 | L27 | PBMCs | 2.5 µL | |
| CD62L | BV480 | V470 | 566174 | DREG-56 | PBMCs | 0.125 µg | |
| CD122 / IL2-RB | BV510 | V510 | 747741 | Mik-β3 | Beads | 2.5 µL | |
| IgG | BV605 | V595 | 563246 | G18-145 | Beads | 2.5 µL | |
| CD56 | BV650 | V660 | 564057 | NCAM16.2 | PBMCs | 0.125 µg | |
| CD303 | BV711 | V710 | 748002 | V24-785 | Beads | 1.25 µL | |
| KLRG1 | BV750 | V750 | 753692 | Z7-205.rMAb | PBMCs | 1.25 µL | |
| CD123 | BV786 | V785 | 564196 | 7G3 | Beads | 0.125 µg | |
| Blue | CD57 | FITC | B510 | 555619 | NK-1 | PBMCs | 0.03 µg |
| CD4 | RB545 | B537 | 569183 | SK3 | PBMCs | 0.06 µg | |
| CD11c | BB630 | B602 | Custom | B-LY6 | PBMCs | 0.5 µg | |
| CD27 | BB660 | B660 | Custom | M-T271 | PBMCs | 0.0125 µg | |
| CD45 | PerCP | B675 | 340665 | 2D1 | PBMCs | 10 µL | |
| CD279 / PD-1 | BB700 | B710 | 566460 | EH12.1 | PBMCs | 2.5 µL | |
| CD3 | BB755 | B750 | Custom | UCHT1 | PBMCs | 0.025 µg | |
| CCR7 / CD197 | RB780 | B810 | 568748 | 2-L1-A | PBMCs | 1 µg | |
| Yellow Green | CD19 | PE | YG585 | 555413 | HIB19 | PBMCs | 5 µL |
| CD158 | RY586 | YG602 | 753232 | HP-MA4 | Beads | 0.125 µg | |
| CD14 | PE-CF594 | YG660 | 562335 | MφP9 | PBMCs | 0.125 µg | |
| CD95 | PE-Cy5 | YG670 | 559773 | DX2 | PBMCs | 20 µL | |
| 7-AAD | – | YG730 | 559925 | – | PBMCs (10% heat killed) | 5 µL | |
| TCRγδ | PE-Cy7 | YG780 | 655434 | 11F2 | PBMCs | 1.25 µL | |
| Red | HLA-DR | APC | R675 | 559868 | TU36 | PBMCs | 20 µL |
| IgD | R718 | R730 | 567993 | IA6-2 | PBMCs | 0.125 µg | |
| CD8 | APC-H7 | R780 | 641409 | SK1 | PBMCs | 0.03 µg |
Transferring panels from a cell analyzer to a cell sorter
A common workflow in immunophenotyping is to create a panel on an analyzer to inspect the sample and identify which cell populations need more detailed characterization. A cell sorter then isolates the cell population(s) of interest for downstream analysis such as single-cell genomics or single-cell proteomics. However, transferring a panel from a cell analyzer to a cell sorter is not always straightforward as the analyzer and the sorter might not be designed or configured in a similar way. In such cases, migrating a panel often entails re-optimization of the parameters for analysis/sorting or even a complete redesign of the entire panel itself.
Our 33-color panel was directly transferred from the BD FACSymphony™ A5 SE Cell Analyzer to the BD FACSymphony™ S6 SE Cell Sorter without the need for re-optimization. These instruments have identical laser configurations and filter sets, facilitating a straightforward transfer. As shown below, the sorted population could be reanalyzed to confirm fidelity of the sort gate as the original analyzed subpopulation.
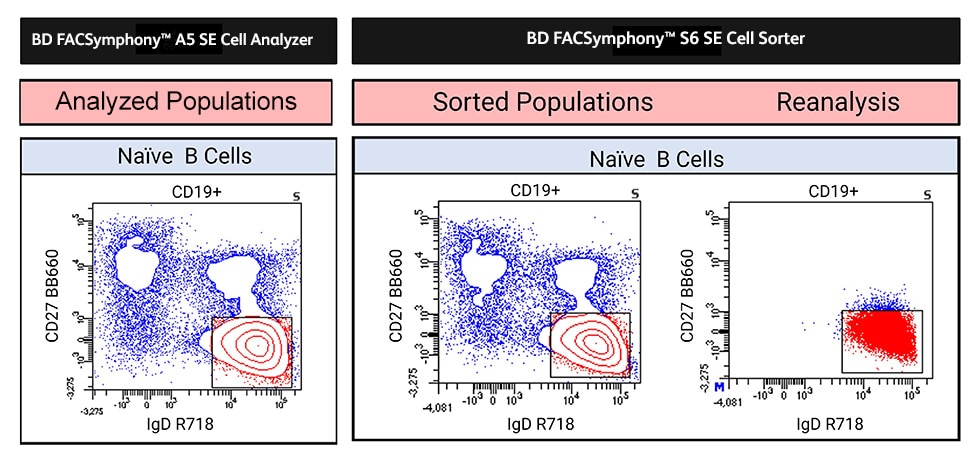
An analyzed subpopulation was sorted and reanalyzed to demonstrate transferability from analyzer to sorter.
Our 33-color immunophenotyping panel for high-dimensional cell analysis leverages the synergy between reagents, instruments and software tools to enable analysis and sorting of immune cells.
Our 33-color panel sheet provides more information on:
- Instrument configuration and reagent selection
- Sample data on the analysis of immune cell subpopulations using the 33-color spectral panel
- Panel transfer from cell analyzer to cell sorter for the isolation of specific cell populations
Download our panel sheet “Immunophenotyping and cell isolation with high-parameter spectral flow cytometry.”