Overview
Immuno-oncology (IO) focuses on exploiting the immune system to elicit appropriate anti-tumor responses and to block the progression of cancer. The immune system is naturally equipped with defense mechanisms to prevent invasion by pathogens. Immunological checkpoints, such as programmed cell death protein-1 (PD-1) and CTLA-4, are an integral part of the repertoire of checks and balances available in the body for preventing attacks on its own immune cells. Such an ability to discriminate between self and non-self is critical for preventing uncontrolled immune responses. Cancer cells and the tumor microenvironment, however, can adopt these immunological checkpoints to pose as “self” molecules and evade the natural defense of the body’s own immune system. Tumor cells can express the PD-1 ligand (PD-L1) on their surface to bind with PD-1 and activate this brake or off-switch of the immune system. Immuno-oncology approaches involve breaking this manipulation of immune checkpoint proteins by using inhibitors (e.g., anti-PD-1/PD-L1 agents) to block PD-1/PD-L1 interaction and allow the recognition of tumor cells by the immune system.1 Combining immunotherapy with other standard of care options, such as surgery, radiotherapy and chemotherapy, has also been adopted recently.

Tumor microenvironment
The tumor microenvironment (TME), which includes blood and lymph vessels and mesenchymal and immune cells, is a major contributor to tumor progression and therapy outcome. TME characteristics have been linked to response or resistance to therapy with high infiltration of cytotoxic T cells supporting a better immune response to attack tumor cells.2 Modulation of TME is also a strategy used for tumor suppression. T cell-targeted immunomodulators such as monoclonal antibodies against PD-1 or CTLA-4 are used in combination with T cells engineered with chimeric antigen receptor (CAR) (CAR-T cells) against several malignancies in clinical trials.3 The fourth generation of (CAR) design attempts to deliver cytokines to modulate the TME either by activating host effector T cells or hampering host suppressors and reinforcing memory T cells. These cytokine-producing CARs, called T cells redirected for universal cytokine killing (TRUCKs), can deliver a variety of cytokines, such as IL-12, IL-15, IL-18 or IL-21 to control immune effector functions.4
Cancer stem cells
Cancers consist of a heterogeneous cell population with different functions and phenotypes. A proportion of cancer cells with stem cell characteristics, known as cancer stem cells (CSC), have been described in several cancer types including colon, brain, lung, breast, ovarian and blood cancers. CSCs serve as a pool to replenish the tumor core with more differentiated cancer cells and are considered as a source of resistance to conventional cancer therapy (e.g., radiotherapy, chemotherapy) and for tumor relapse. A ratio of CSC:non-CSC in favor of CSC correlates with poor survival.5 CSCs are actively being evaluated as targets in oncology therapy including immuno-oncology therapeutic approaches, such as anti-CD44 antibodies and STAT3 inhibitor VII in breast cancer, tarextumab against Notch 2/3 in small cell lung carcinoma, and myrtucommulone-A and motesanib against PI3K/AKT in bladder cancer.6 According to the 2018 GLOBOCAN study, tumors with the highest mortality rates (e.g., lung, stomach, liver, breast, colorectal cancers) are usually highly heterogeneous and exhibit different extents of stem cell activities.7
References
- Wu X, Gu Z, Chen Y, et al. Application of PD-1 blockade in cancer immunotherapy. Comput Struct Biotechnol J. 2019;17:661-674. doi:10.1016/j.csbj.2019.03.006
- Shen R, Li P, Li B, Zhang B, Feng L, Cheng S. Identification of distinct immune subtypes in colorectal cancer based on the stromal compartment. Front Oncol. 2020;9:1497. doi:10.3389/fonc.2019.01497
- Feins S, Kong W, Williams EF, Milone MC, Fraietta JA. An introduction to chimeric antigen receptor (CAR) T-cell immunotherapy for human cancer. Am J Hematol. 2019;94(S1):S3-S9. doi: 10.1002/ajh.25418
- Knochelmann HM, Smith AS, Dwyer CJ, Wyatt MM, Mehrotra S, Paulos CM. CAR T cells in solid tumors: Blueprints for building effective therapies. Front Immunol. 2018;9:1740. doi: 10.3389/fimmu.2018.01740
- Pan Y, Ma S, Cao K, et al. Therapeutic approaches targeting cancer stem cells. J Cancer Res Ther. 2018;14(7):1469-1475. doi:10.4103/jcrt.JCRT_976_17
- Shibata M, Hoque MO. Targeting cancer stem cells: a strategy for effective eradication of cancer. Cancers (Basel). 2019;11(5):732. doi:10.3390/cancers11050732
- Walcher L, Kistenmacher AK, Suo H, et al. Cancer stem cells-origins and biomarkers: perspectives for targeted personalized therapies. Front Immunol. 2020;11:1280. doi:10.3389/fimmu.2020.01280
Types of immuno-oncology therapy trials and their targets
Different types of immuno-oncology (IO) therapies are actively being investigated.1 When organized by mechanism of action (MOA), six classes of IO therapies can be described, including cell therapies, cancer vaccines, oncolytic viruses, T cell targeted immunomodulators, other immunomodulators and CD3-targeted bispecific antibodies.1
Cell therapies
Cell therapy offers the promise to cure or lessen the burden of a disease by transferring intact and healthy live cells in a patient’s body. It is an active area of research touching a wide range of diseases. Adoptive cell therapy (ADC) is an example of approved cell therapy in immuno-oncology. ADC or cellular immunotherapy is the use of a patient’s own immune cells to fight cancer. The cells are either re-infused into the patient as is after expansion to increase the count of tumor fighting immune cells or they can be engineered to be more efficient in recognizing and eliminating tumor cells. An example of ADC is CAR-T cell therapy.2
Cancer vaccines
Cancer vaccines may be prophylactic or therapeutic. Prophylactic cancer vaccines are administered to healthy individuals to prevent the development of cancer. Some examples of approved therapeutic cancer vaccines include the hepatitis B virus (HBV) vaccine to prevent the ultimate development of hepatocellular carcinoma (HCC) and the human papilloma virus (HPV) vaccine, which is used to prevent cervical cancer. Therapeutic cancer vaccines are administered to cancer patients to eradicate an already ongoing cancer by strengthening the ability of the patient’s immune system to fight the cancer.
Oncolytic viruses
The use of oncolytic viruses as cancer immunotherapy exploits the abilities of some well-recognized viruses to elicit immunogenic cell death. This allows the exposition of multiple tumor-associated antigens that were hiding from immune detection. They can then be processed for presentation to the immune system via activated mature dendritic cells. When numbers of virus genomes are high, immunological danger signaling through damage-associated molecular pattern (DAMP) and pathogen-associated molecular pattern (PAMP) receptors are activated. This activation state retargets the adaptive immune system, including cytotoxic CD8+ T cells and helper CD4+ T cells, towards the tumor, thus lifting local immunosuppression.
T cell targeted immunomodulators
Some examples of these therapies utilizing T cell-targeted immunomodulators include monoclonal antibodies against PD-1 or CTLA-4 and some emerging co-stimulatory molecules as targets for immunotherapy include 4-1BB and OX40.
Checkpoint blockade therapies inhibit the interaction between cognate receptors and their ligands. They include antibody drug conjugates, cytokine therapy, tumor-specific T cells and dendritic cell vaccines.
Immune modulators acting on other immune cells or the TME
Besides T cells, NK cells are also being explored as potential candidates for use in cell therapy based on several lines of evidence. Downregulation of HLA-I levels can induce NK cell-mediated killing through a “missing-self” recognition mechanism.3 The inhibitory mechanism includes killer immunoglobulin-like receptors (KIRs) and CD94/NKG2A, which can recognize major histocompatibility complex (MHC) class I molecules.
Other immunomodulators, including those agonists against toll-like receptors (TLR) or interferon-α/β receptor 1 (IFNAR1), are actively being investigated.
CD3-targeted bispecific antibodies
CD3-targeted bispecific antibodies (e.g., blinatumomab) are used to redirect naïve T cells and induce target cell–specific lysis.
References
- Tang J, Shalabi A, Hubbard-Lucey VM. Comprehensive analysis of the clinical immuno-oncology landscape. Ann Oncol. 2018;29(1):84-91. doi:10.1093/annonc/mdx755
- Maus MV, June CH. Making better chimeric antigen receptors for adoptive T-cell therapy. Clin Cancer Res. 2016;22(8):1875-1884. doi:10.1158/1078-0432.CCR-15-1433
- Minetto P, Guolo F, Pesce S, et al. Harnessing NK cells for cancer treatment. Front Immunol. 2019;10:2836. 10.3389/fimmu.2019.02836
BD Biosciences provides total solutions to your immuno-oncology research workflow
From specimen collection to sample preparation to cell analysis, BD Biosciences offers a multitude of tools for immuno-oncology research.
Sample collection
The BD Vacutainer® family of products can be used for blood cell and biomarker preservation.
Sample preparation tools
The BD Horizon™ Dri Tumor and Tissue Dissociation Reagent (TTDR) offers gentle and effective dissociation with superior epitope preservation. TTDR maximizes cell yields, while minimizing cell death, which allows effective dissociation of a variety of tumor types to enable single-cell studies.
Tumor types evaluated by BD or external investigators include lung, breast, colon, lymphoma, melanoma/skin, pancreatic, esophageal, kidney, sarcoma and brain.

-
Surface marker expression
Maker Pop SI MFI % pos CD1a CD1b CD1d 5 CD2 4 CD3 4 CD4 4 CD4v4 4 CD5 4 CD6 4 CD7 4 CD8a 4 CD8b 4 CD9 4 CD10 1 CD11a 4 CD11b 6 CD11c 6 CD13 6 CD14 5 CD15 5 CD15s 5 CD16 6 CD18 5 CD19 3 CD20 3 CD21 CD22 CD23 CD24 6 CD25 4 CD26 4 CD27 4 CD28 4 CD29 4 Maker Pop SI MFI % pos CD30 4 CD31 5 CD32 6 CD33 5 CD34 CD35 6 CD36 5 CD37 5 CD38 5 CD39 5 CD40 1 CD43 4 CD44 6 CD45 4 CD45RA 3 CD45RB 3 CD45RO 6 CD46 1 CD47 1 CD48 5 CD49a 2 CD49b 2 CD49c 1 CD49d 4 CD49e 2 CD50 6 CD51/61 5 CD53 6 CD54 2 CD55 6 CD56 3 CD57 3 CD58 4 CD59 1 Maker Pop SI MFI % pos CD61 5 CD62E CD62L 4 CD62P CD63 2 CD64 5 CD66(a-e) 6 CD66b 6 CD66f CD69 5 CD70 5 CD71 1 CD72 CD73 2 CD74 5 CD75 CD77 CD79b CD80 CD81 4 CD83 5 CD84 5 CD85 5 CD86 5 CD87 6 CD88 6 CD89 5 CD90 CD91 5 CDw93 6 CD94 9 CD95 5 CD97 5 CD98 5 Maker Pop SI MFI % pos CD99 5 CD99R CD100 CD102 5 CD103 CD105 1 CD106 CD107a 2 CD107b 6 CD108 5 CD109 4 CD112 CD114 5 CD116 5 CD117 CD118 2 CD119 5 CD120a 5 CD121a 2 CD121b 5 CD122 3 CD123 2 CD124 5 CD126 CD127 4 CD128b 5 CD130 5 CD134 CD135 CD137 5 CD137L CD138 CD140a 2 CD140b 2 Maker Pop SI MFI % pos CD141 1 CD142 1 CD144 CD146 2 CD147 1 CD150 4 CD151 1 CD152 2 CD153 5 CD154 CD158a 3 CD158b 9 CD161 9 CD162 5 CD163 5 CD164 5 CD165 5 CD166 5 CD171 5 CD172b 5 CD177 7 CD178 CD180 5 CD181 6 CD183 4 CD184 5 CD193 CD195 5 CD196 CD197 CD200 CD205 5 CD206 5 CD209 5 Maker Pop SI MFI % pos CD220 5 CD221 1 CD226 4 CD227 5 CD229 4 CD231 1 CD235a CD243 CD244 5 CD255 5 CD268 3 CD271 1 CD273 CD274 2 CD275 5 CD278 CD279 CD282 5 CD305 5 CD309 CD314 4 CD321 5 CDw327 3 CDw328 5 CD329 5 CD335 3 CD336 CD337 3 CD338 5 CD340 1 ebTCR 4 b2-microglobulin 4 BETR-1 6 CLIP 3 Maker Pop SI MFI % pos EGF Receptor 1 fMLP Receptor 5 gdTCR 4 HPC HLA-A,B,C 5 HLA-A2 5 HLA-DQ 5 HLA-DR 5 HLA-DR,DP,DQ 5 Invariant NK T DGD2 5 MIC A/B 5 NKB1 SSEA-1 6 SSEA-4 2 TRA-1-60 3 TR-1-81 Vb23 Vb8 CD326 1 CD49f 1 CD104 1 CD120b 5 CD132 5 CD201 1 CD210 5 CD212 CD267 5 CD294 6 CLA 6 Integrin b7 10 Surface marker expression was assessed across the BD catalog for all 10 distinct cell populations. Markers that demonstrated less than 20% expression are represented as grey boxes. For each marker, a single population (T cells, non-T cells) was chosen for the analysis. Untreated and treated (exposed to enzyme) samples were compared using stain index (SI), mean fluorescence intensity (MFI) of positive signal and the % of the population that was clearly positive for a given marker (% pos). Bright blue indicates a change of less than 15%, light blue indicates a change of 16%–30% and dark blue indicates a change of 30% or more.
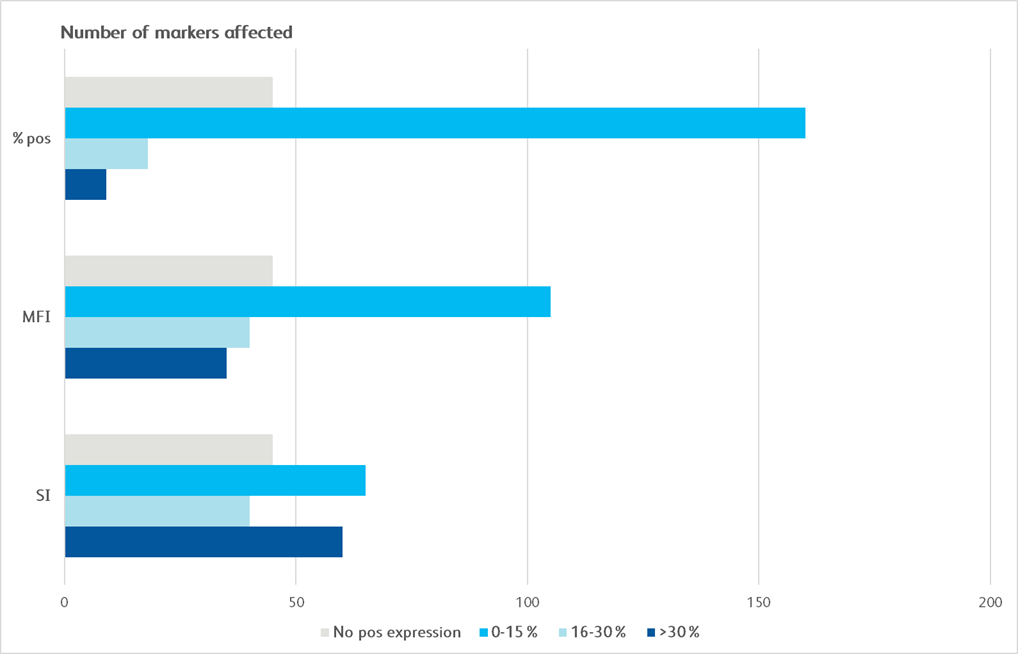
Graphical depiction demonstrating majority markers measured had preserved epitopes measured by MFI and SI, showing less than 0–30% change following dissociation.
Cell staining, characterization and analysis tools
BD Biosciences offers a comprehensive portfolio of over 9,000 immunology and immuno-oncology-related reagents that are designed for efficient characterizations of cells.
The pretitrated dried reagent cocktails of BD Horizon™ Dri Panels are ready to use multicolor panels for memory T cell, monocyte subset, TB&NK and Treg cell characterization.
In addition to predesigned panels, our custom solutions offer contract manufacturing of multicolor panels in lyophilized, liquid or dried formats to minimize the error(s) and time associated with manual cocktailing of reagents, increase reagent stability, and significantly enhance performance consistency.
The BD Horizon Brilliant™ Polymer Dyes were developed from advanced Sirigen dye technology, enabling high-parameter flow cytometry experiments for discerning cell populations. The bright dyes help in distinguishing dim cell populations, such as tumor-infiltrating lymphocytes or cells that have few receptors on the surface from other cells in a sample.
BD Horizon™ Dri Monoset Panel
| Fluorochrome | Marker | Clone |
|---|---|---|
| FITC | CD16 | 3G8 |
| PE | HLA-DR | L243 |
| PerCP | CD14 | MΦP9 |
| APC | CD192 (CCR2) | LS132.1D9 |
BD Horizon™ Dri Memory T-Cell Panel
| Fluorochrome | Marker | Clone |
|---|---|---|
| FITC | CD197 | 150503 |
| PE-Cy7 | CD95 | DX2 |
| BD Horizon™ APC-R700 | CD27 | M-T271 |
| APC-H7 | CD3 | SK7 |
| BD Horizon™ V450 | CD4 | SK3 |
| BD Horizon™ V500-C | CD8 | SK1 |
| BD Horizon Brilliant™ Violet 605 | CD45RA | HI100 |
BD Horizon™ Dri TBNK+CD20 Reagent Panel
| Fluorochrome | Marker | Clone |
|---|---|---|
| BD Horizon Brilliant™ Violet 450 | CD20 | L27 |
| FITC | CD95 | DX2 |
| PE | CD16 | B73.1 |
| PE | CD56 | NCAM16.2 |
| PerCP-Cy5.5 | CD45 | 2D1 (Hle-1) |
| APC | CD19 | SJ25C1 |
| PE-Cy7 | CD4 | SK3 |
| APC-Cy7 | CD8 | SK1 |
Cell Sorters
The BD FACSMelody™ Cell Sorter provides, simple, fast and quality cell sorting ideal for enrichment of rare populations.
Fluorescence activated cell sorting of hematopoietic stem and progenitor cells for downstream single-cell multiomics analysis to study tumor-driven perturbations in hematopoiesis.
Isolation of hematopoietic stem and progenitor cells from healthy and tumor-burdened mice for downstream single-cell multiomics analysis.
Right: C57BL/6 mice were injected subcutaneously with either B16-F10 melanoma cells (tumor-burdened mice, n = 4) or control media (healthy mice, n = 4). Bone marrow and spleen tissues were harvested after 21 days. Bone marrow and spleen cells from healthy or tumor-burdened mice were mechanically separated and enriched using the BD IMag™ Mouse Hematopoietic Progenitor (Stem) Cell Enrichment Set.

The cells were stained with the antibody-fluorochrome conjugates listed in the table. The BD FACSMelody™ Cell Sorter was used to acquire and isolate the hematopoietic stem and progenitor cells (HSPCs). Cells were first gated for lineage negative and live cells, followed by doublet cell discrimination (not shown). LSK hematopoietic stem cells were gated as Lin- Sca1+ cKit+ within the CD127- population. Hematopoietic progenitor cell populations; MEP (megakaryocyte-erythrocyte progenitor), CMP (common myeloid progenitor) and GMP (granulocyte-macrophage progenitor) were identified within the Sca1- cKit+ gate based on expression of CD34 v CD16/CD32. Pseudocolor contour plots generated in BD FACSChorus™ Acquisition Software illustrate the strategies to sort LSK, MEP, CMP and GMP cells from healthy bone marrow (A), tumor-burdened bone marrow (B) and tumor-burdened spleen tissues (C). Sorted cells were used for downstream single-cell multiomics analysis. (D) Population hierarchy for the gating and sort strategy is shown. (E) Sorted cells from bone marrow of healthy mice were analyzed on the BD FACSMelody™ Cell Sorter for purity check. Purity for each of the four populations (LSK, MEP, CMP and GMP), which were sorted simultaneously from the healthy bone marrow sample, is shown on the respective pseudocolor contour plots. Percent parent statistics are also indicated.
Cell analyzers
Multicolor flow cytometry with the BD FACSCelesta™ Flow Cytometer enables comprehensive immunophenotypic analysis of exhausted T cells.
Right: Co-expression patterns of inhibitory receptors in unstimulated and in vitro stimulated CD8+ and CD4+ T cells. The use of bivariate plots enabled the identification of complex co-expression patterns of inhibitory receptors and highlights the heterogeneous phenotype of in vitro persistently stimulated T cells and immunophenotypic analysis of exhausted T cells.
Plot analysis was performed to identify subsets of total CD8+ T and CD4+ cells co-expressing inhibitory receptors within fresh, unstimulated PBMCs and T cells persistently stimulated in vitro with Dynabeads™ Human Activator CD3/CD28 and human recombinant IL-2 for 9 days.

A. Bivariate plot analysis provided information on the heterogeneity of CD8+ T cells co-expressing inhibitory receptors. For example, distinct subsets of cells expressing only TIGIT, only PD-1 or co-expressing both inhibitory receptors were detected. B. More complex patterns of expression were observed upon persistent stimulation in vitro that resulted in differential regulation of the inhibitory receptors tested. For example, while the overall percentage of CD8+TIGIT+ cells decreased, an increase in cells co-expressing PD-1 and TIGIT was observed. Interestingly, only a small, discrete subset of CD8+ cells upregulated CTLA-4 expression, thus confirming the heterogeneity of cells persistently stimulated. (C–D) Similar observations were made for CD4+ T cell subsets.
The BD FACSLyric™ Flow Cytometry System helps in driving reproducibility and standardization. The BD FACSLyric™ Flow Cytometry System solution combines simplicity, speed and automation to ease workflow and improve productivity. This next-generation flow cytometer enables standardization and collaboration through consistent results and assay portability capabilities.

Right: Demonstration of immune checkpoint receptor expression on activated T cells that are regulated in part by time-in-culture or by stimulatory conditions using the BD FACSLyric™ Analyzer. Intermediate concentrations (50 ng/mL) of PMA plus ionomycin appeared to induce robust upregulation of CD134, CD137, PD-L1/CD274, HLA-DR, CD86, CD152 and PD-1/CD279 in CD3+ T cells.
Expression of immune checkpoint receptors on peripheral blood immune cells using a 10-color assay on the BD FACSLyric™ Flow Cytometer
| Target antigen | Alternate name | Clone | Fluorophore | Cat. no. |
|---|---|---|---|---|
| CD45 | PTPRC | 2D1 | APC-H7 | 560178 |
| CD3 | n/a | SK7 | PerCP-Cy5.5 | 340949 |
| HLA-DR | n/a | G46-6 | BD Horizon™ BV510 | 563083 |
| CD28 | n/a | CD28.2 | PE-Cy7 | 560684 |
| CD134 | 0X40 | ACT35 | PE | 555838 |
| CD137 | 4-1BB | 4B4-1 | APC | 550890 |
| CD274 | PD-L1 | M1H1 | FITC | 558065 |
| CD86 | B7-2 | 2331 | Alexa Fluor™ 700 | 561124 |
| CD152 | CTLA-4 | BN13 | BD Horizon™ BV421 | 562743 |
| CD279 | PD-1 | EH12.1 | BD Horizon™ BV605 | 563245 |
Multiomics
BD offers a wide range of multiomic solutions to help empower and streamline your research. The BD Rhapsody™ Single-Cell Analysis System with BD® AbSeq Oligonucleotides provides a comprehensive single-cell workflow solution to increase the experimental power for your research. BD® AbSeq Oligonucleotides enables synergies with high-parameter flow cytometry, allowing discoveries with BD® AbSeq Olionucleotides to transfer to panel design and WTA discoveries transfer to targeted panels.
BD® AbSeq Oligonucleotides characterizing CAR CD19 T cells (right). Participants from a trial at Westmead Hospital (Sydney, Australia) using CAR T cells based on 4-1BB coreceptor (instead of CD28) and the piggyBAC system for gene modification. Development of a single-cell multiomics approach was used to study the molecular, functional and transcriptomic profile of CAR T cells in the pre-infusion product and the blood of patients following adoptive transfer.

This was to test the hypothesis that survival of CAR T cells post-infusion is driven by long-term stem memory T cells (TSCMs). TSCMs are identified as a minor subset within the CAR T cell product and these are found expanded in the blood of patients up to 100 days post-CAR T cell post-infusion (data not shown).
The BD Rhapsody™ Single-Cell Analysis System enables high-throughput single cell multiomic analyses and includes a microwell-based instrument platform equipped with quality monitoring features; an array of RNA and protein assays such as the whole transcriptome assay, targeted RNA panels and TCR/BCR profiling assays; BD® AbSeq Antibody-Oligo’s; and software tools. The BD Rhapsody™ System works seamlessly with other upstream BD cell enrichment technologies such as fluorescence-activated cell sorting enabling users to deep dive into their select cells of interest. The BD Rhapsody™ System can be used effectively in several single-cell multiomics applications, including immuno-oncology research.

Informatics
BD offers a variety of powerful software applications to help you quickly and easily analyze your data including FlowJo™ and SeqGeq™ Software. FlowJo™ Software is the leading platform for single-cell flow cytometry analysis and the new release (FlowJo™ v10.6 Software) can take your analysis to the next level with new features including spectral compensation, kinetic overlays, improved BD FACSDiva™ Software support and more. SeqGeq™ v1.6 Software is a desktop bioinformatics platform that makes complex scRNA-Seq analysis accessible with an intuitive interface. Explore, visualize and shape your next-gen sequencing data with interactive graphs that are designed to help you focus on what matters most.

Research Use Only. Not for use in diagnostic or therapeutic procedures.
BD flow cytometers are Class 1 Laser Products.
Alexa Fluor is a trademark of Life Technologies Corporation.
Cy is a trademark of Global Life Sciences Solutions Germany GmbH or an affiliate doing business as Cytiva.