





Overview
BD® AbSeq Antibody-Oligos enable single-cell CITE-seq analyses (simultaneous detection of proteins and mRNA expression) and help deepen your understanding of protein biology to accelerate your single-cell research.
In addition to cell surface protein analyses, BD® AbSeq Antibody-Oligos can now also be used for intracellular CITE-seq.
Learn more from the BD® AbSeq Assay brochure
Check out our BD® AbSeq Immune Discovery Panel
Check out the Intracellular CITE-seq Assay using BD® AbSeq Antibody-Oligos

FEATURES
The BD® AbSeq Assay provides enhanced cell type identification and high-dimensional protein profiling
The assay:
- Elucidates complex biological systems with distinct clustering of different cell subsets
- Enables interrogation of tens to hundreds of protein markers in a single experiment
- Integrates seamlessly with a catalog of RNA assays—whole transcriptome analyses, targeted RNA assays, TCR and BCR profiling and multiplexing—to serve as a single multiomics solution
- Provides a broad range of specificities including surface and intracellular proteins such as transcription factors, all part of a validated BD antibody portfolio
- Is designed for use with the BD Rhapsody™ Single-Cell Analysis Systems
- Provides customer-friendly analyses through integration with the BD Rhapsody™ Sequence Analysis Pipeline
APPLICATIONS
Detect up to 100 different cell surface markers using the BD® AbSeq Assay with high confidence

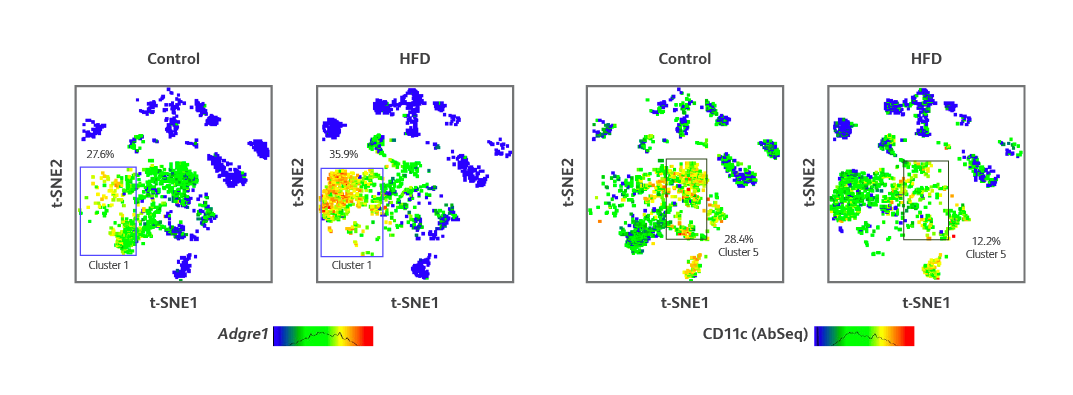
Single-cell AbSeq and targeted mRNA-Seq analyses of myeloid cell populations localized in adipose tissue from control and HFD mice. t-SNE visualization of differences in expression of Adgre1 (encodes F4/80) gene expression and CD11c protein expression (identified via AbSeq) in different cell clusters of myeloid cells from the adipose tissue of HFD mouse.
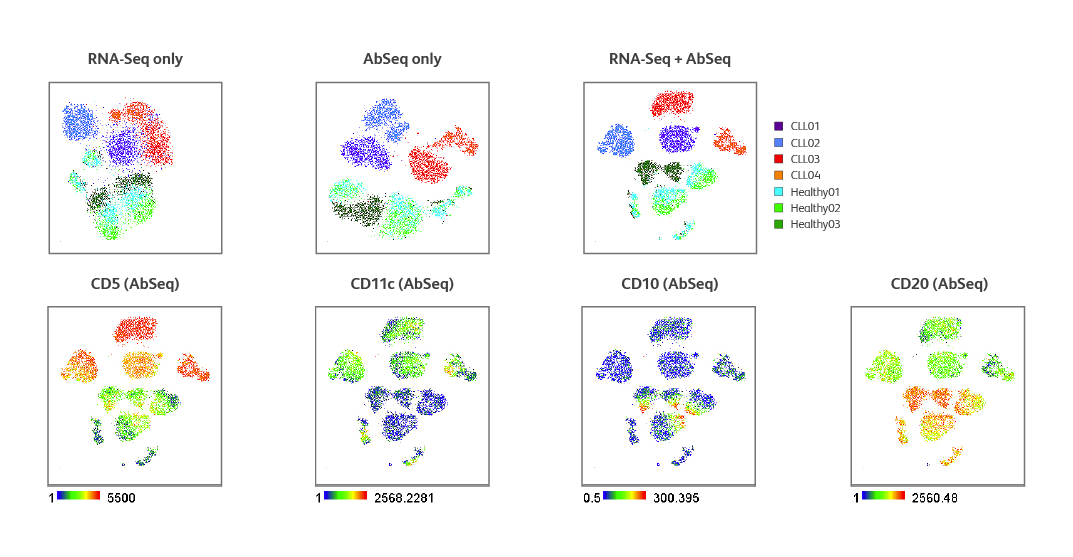
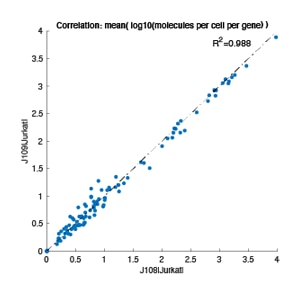
Multiomic analysis of CLL samples and healthy donors. t-SNE clustering of healthy and CLL patient samples using mRNA or surface protein only or a combination of both. Expression of key cell surface markers identified by the BD® AbSeq Assay in both healthy and CLL samples.
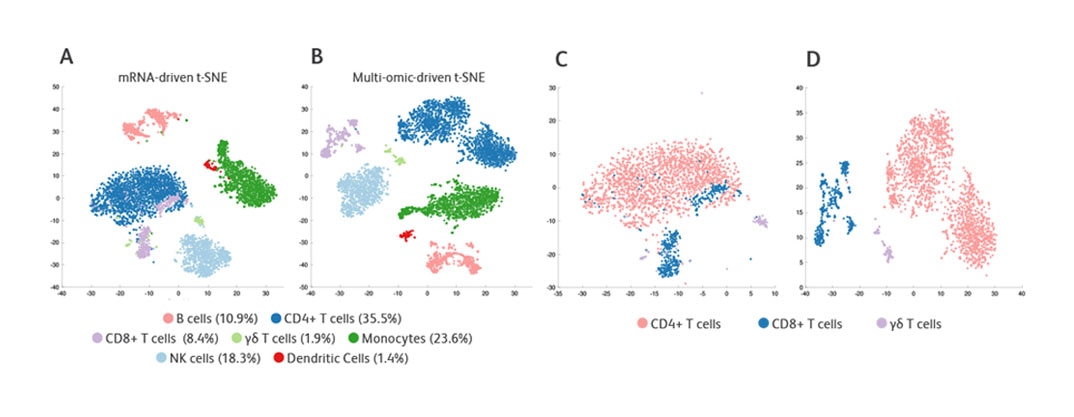
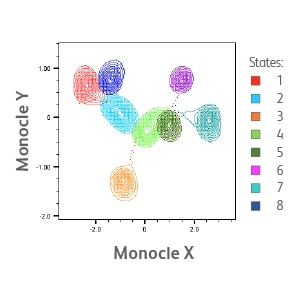
t-SNE clustering of PBMCs using mRNA or multiomic data. A, B. t-SNE coordinates are calculated for all PBMCs based on mRNA data only. Cells are colored based on cell type. C, D. Same coordinates as in A and B, but only T-cell subsets are displayed. Markers used for cell-type definition (protein data used for all markers except FcγRIIIa, for which mRNA data were used)—CD4 T-cells: CD3+CD4+; CD8 T-cells: CD3+CD8+; γδ T-cells: CD3+TCRγδ+; B cells: CD19+; Monocytes: CD14+; NK cells: CD3-CD45RA+ FcγRIIIA-high.
-
Brochure
(2)

-
Data Sheet
(4)
-
 A Comprehensive Characterization of Regulatory T Cells Using BD Rhapsody™ Single-Cell Analysis System
-
Assessing Obesity-Induced Inflammation in Mice Through Single-Cell Multiomic Analysis
-
Exploring Tumor Heterogeneity of Chronic Lymphocytic Leukemia Using Single-Cell Multiomics
-
Simultaneous mRNA and Protein Quantification
-
Presentations
(2)
-
Protocols
(10)
-
BD Rhapsody™ System Single-Cell Labeling with BD® AbSeq Ab-Oligos for Intracellular CITE-seq Protocol
-
Flow Cytometry Analysis of BD® AbSeq Ab-Oligo and Sample Tag Expression Protocol
-
mRNA Targeted and BD® AbSeq Library Preparation with the BD Rhapsody™ Targeted mRNA and AbSeq Amplification Kit Protocol
-
mRNA Targeted, Sample Tag, and BD® AbSeq Library Preparation with the BD Rhapsody™ Targeted mRNA and AbSeq Amplification and BD Single-Cell Multiplexing Kits Protocol
-
Preparing Single-Cell Suspensions Protocol
-
Single-Cell Capture and cDNA Synthesis with the BD Rhapsody™ Express Single-Cell Analysis System Protocol
-
Single-Cell Labeling with BD Single-Cell Multiplexing Kit and BD AbSeq Ab-Oligos (41 plex to 100 plex) 23-22951(01) Single-Cell Capture and cDNA Synthesis with the BD Rhapsody Single-Cell Analysis System
-
Single-Cell Labeling with BD Single-Cell Multiplexing Kit and BD AbSeq Ab-Oligos (41 plex to 100 plex)
-
Single-Cell Labeling with the BD® Single-Cell Multiplexing Kit and BD® AbSeq Ab-Oligos Protocol
-
Single-Cell Labelling with BD® AbSeq Ab-Oligos Protocol
-
Technical Note
(1)