Overview
BD Infinicyt™ Software offers a unique research solution to an increasingly demanding workflow. It is a standalone analysis software that can accept FCS files (2.0, 3.0, and 3.1) from any flow cytometer. It offers a variety of classic features and several more-advanced capabilities, such as automated gating and identification. Automated gating is a key pillar in the Next Generation Flow™ technique, which standardizes the workflow of predefined assay panels from sample preparation to automated analysis and reporting.
BD Infinicyt™ Software includes many security tools and features supporting 21 CFR part 11 compliance, increasing reliability of your recordkeeping for good laboratory practices.
Diagrams and Representations
Dot plots, histograms, Boxplots diagrams, Multidimensional plots, and more

Automatic Population Separator (APS)
When analyzing a high number of parameters and events, APS helps users identify cell populations with the most and least similarities and separation. Based on Principal Component Analysis (PCA), APS uses the information from all of the parameters in the file and maps populations in a visually simplistic space.

Clustering
For users who want more control over which parameters to analyze, the level of sensitivity and degree of data similarity, the patented clustering feature automatically identifies similar cell populations and groups them into clusters for further exploration.

Automated Gating, Identification and Reports
Automated analysis and reporting support for predefined Next Generation Flow™ panels
- Normal populations are automatically identified according to their similarity with databases created by the Euroflow™ consortium allowing users to focus on aberrant populations.
- Once analysis is complete, standardized reports are generated with the numeric and phenotypic alterations found in the sample and compared to the normal reference ranges defined in the reference databases.
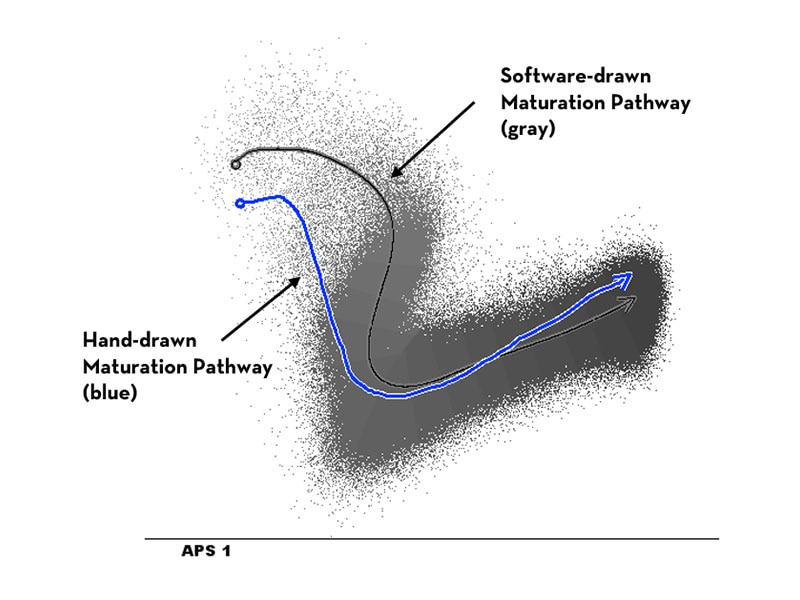
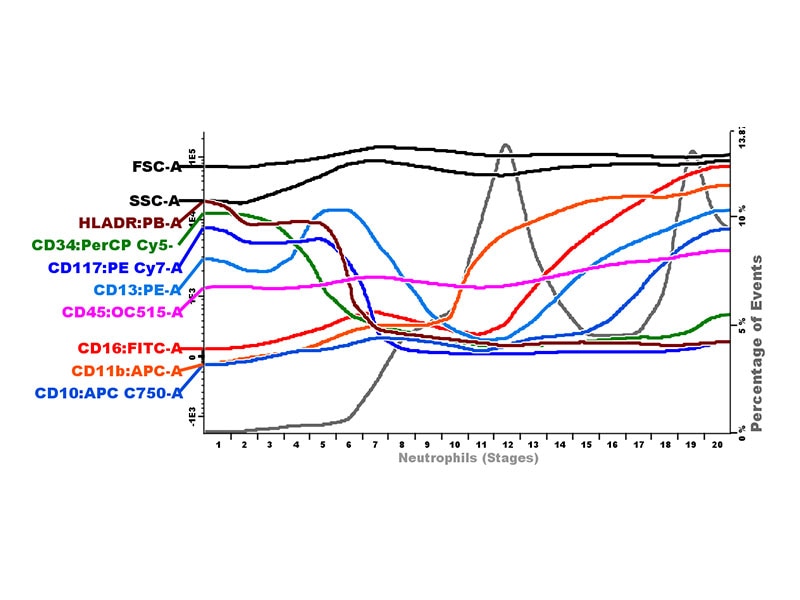
Maturation
- Define maturation pathways in your samples and develop customized reference databases (e.g., myeloid development research). Allow the software to automatically adjust and divide the events into population stages.
- Pathways can be drawn freehand from the early maturation stages to the final ones. They are automatically adjusted by the software taking into consideration the density of events surrounding this pathway.
- The software divides the events into several population stages according to the adjusted pathway. The stages are displayed in the Population Tree and in the Maturation diagram.
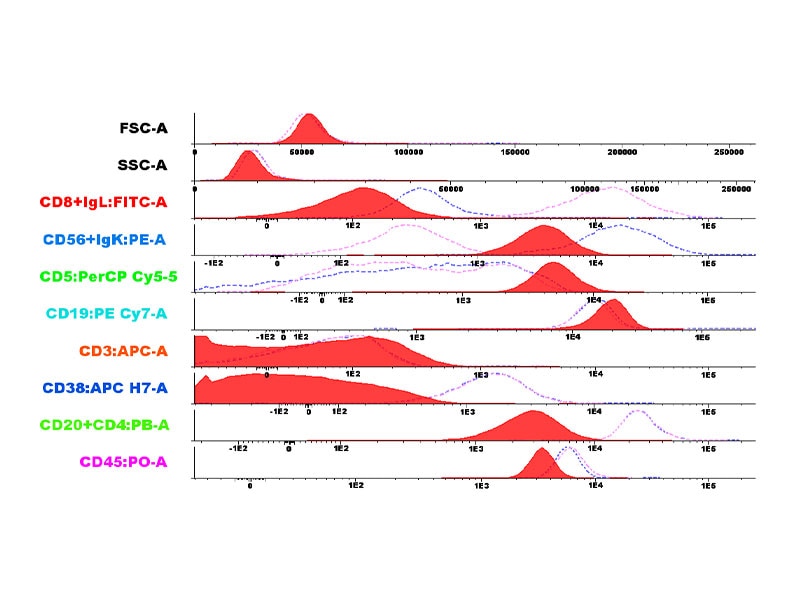
References Images
- Visualize and compare your samples to saved references (e.g., a negative control or a normal population), or track treated samples over time.
- Reference images are displayed on the diagrams with dots or lines. For example, they can be displayed in Parameter Band Histograms to compare the immunophenotype of reference populations against the current sample or track the evolution of treated samples over time.
The Next Generation Flow™ technique increases standardization and efficiency. Next Generation Flow™ is based on the standardization of your entire workflow, from sample preparation of predefined panels to expert-guided automated reports. BD Infinicyt™ Software provides automated analysis and reporting support for Next Generation Flow™ panels using reference databases.
Off-The-Shelf Assay Templates
Templates and databases currently available for the following research assay panels*:
- PIDOT (Primary Immunodeficiency Orientation Tube)
- ALOT (Acute Leukemia Orientation Tube)
- LST (Lymphoid Screening Tube)
- BCP-All MRD (B-Cell Precursor Acute Lymphocytic Leukemia Multiple Minimal Residual Disease)
- MM MRD (Multiple Myeloma Minimal Residual Disease)
- CPC (Circulating Plasma Cells)
*Research assay panels may not be available in all countries.
Automated Gating and Identification
- Facilitates the objective identification of normal cell populations by comparing to databases built with normal reference samples allowing users to focus on aberrant populations.
- Reference databases were created with samples from different centers based on the knowledge and experience of the EuroFlow™ Consortium.
Automatic Reports
Generate comments and conclusions for predefined assays, based on results compared to internal database reference ranges. Immunophenotype of the abnormal population provided. Sample-specific Limit of Detection (LOD) and Lower Limit of Quantitation (LLOQ) definitions and sample quality assessments provided (e.g., hemodilution).
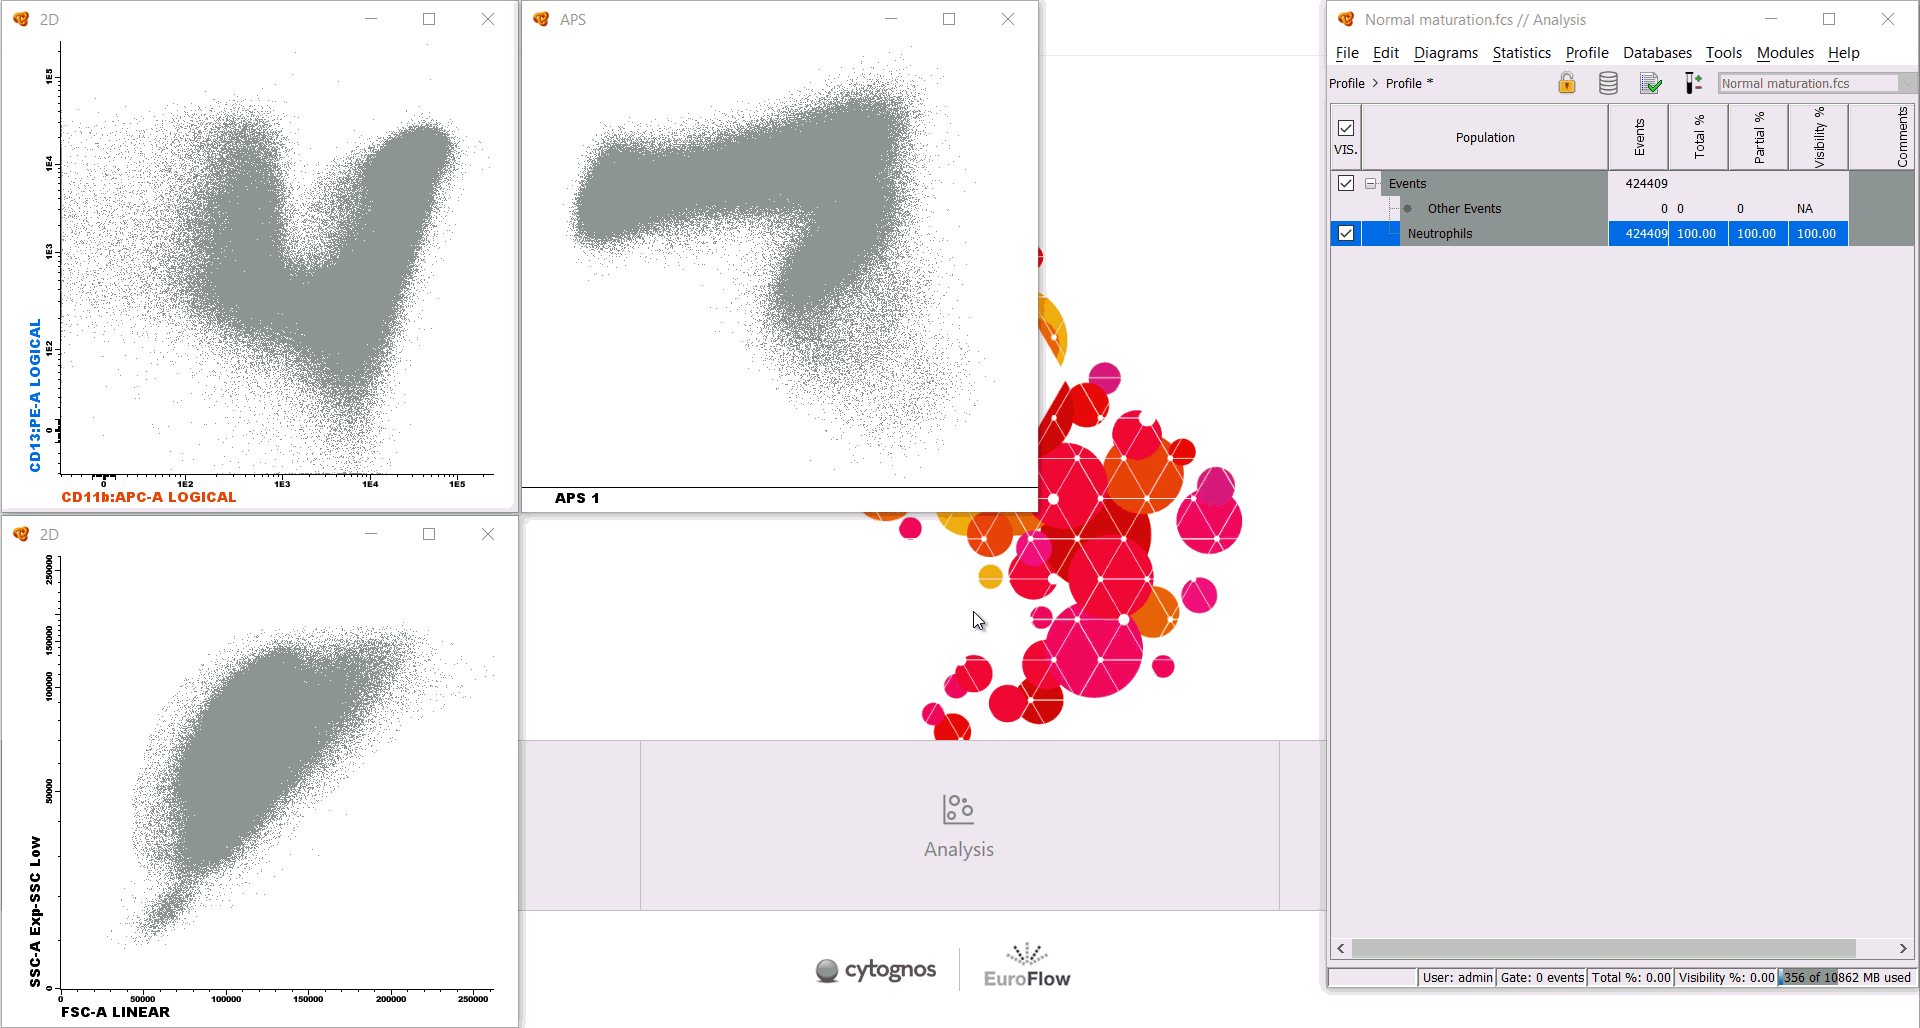
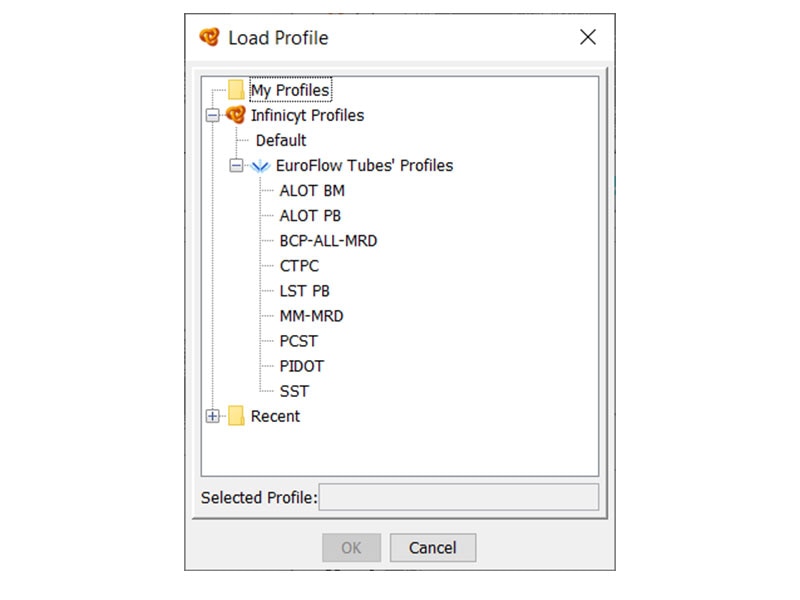
Profiles
- Configure a customized analysis profiles (templates) and save the following elements:
- Dot plots, histograms, boxplot diagrams, multidimensional plots and their specific configurations, population trees, reports, reference images, analysis strategies, export statistics configurations, stored compensations
- Dot plots, histograms, boxplot diagrams, multidimensional plots and their specific configurations, population trees, reports, reference images, analysis strategies, export statistics configurations, stored compensations
- Several preconfigured profiles are also available.
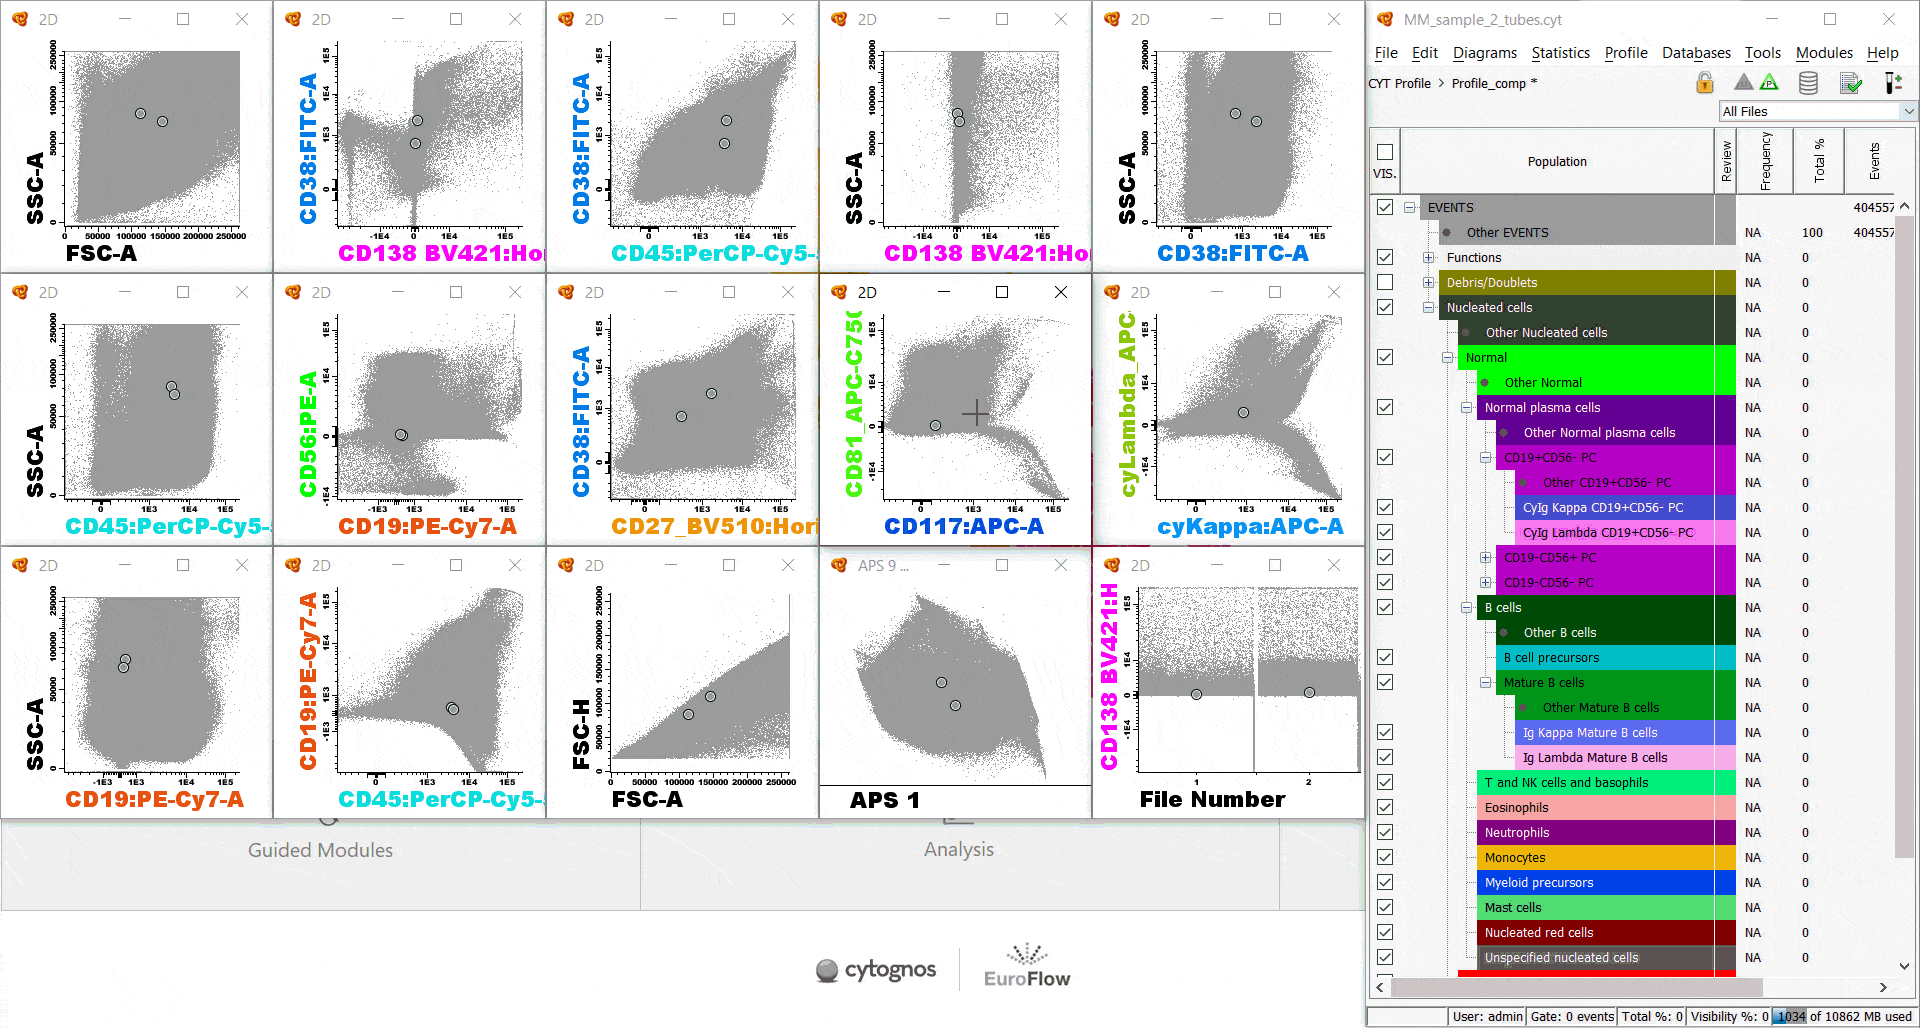
Analysis Desktops
- Load several diagram workspaces for the analysis of different tubes (file merge) or for quality control purposes, all within the same profile.
- In this example, the user is performing manual analysis of the MM-MRD RUO panel on the initial desktop. They are then able to navigate to a second desktop to assess the quality of the acquisition. Issues are observed when parameters are displayed against “Time,” due to the sample running out prior to acquisition being stopped. All impacted events must be disregarded, so they are gated and assigned to the “Debris & Doublets” population.
Analysis Strategies
- Standardize your analysis by saving your gating strategy to apply it to future samples.
- Apply and review the analysis strategy later to ensure that the cells in the current sample fall within the expected gates.
Safety and Security
- Features that support 21 CFR part 11 compliance and increase reliability of your recordkeeping for good laboratory practices.
- User Access Control and Authentication of unique users
- Establish various levels of software access per role and various security policy settings per user.
- Establish various levels of software access per role and various security policy settings per user.
- Password-protected analyzed files
- Ensures electronic record security and helps to prevent unauthorized manipulation of data. Files are also encrypted for increased security during data transmission over a network.
- Ensures electronic record security and helps to prevent unauthorized manipulation of data. Files are also encrypted for increased security during data transmission over a network.
- Audit trails
- Track analysis and reporting actions performed within the file. This time-stamped, user-specific list of actions facilitates analysis traceability of files.
- Track analysis and reporting actions performed within the file. This time-stamped, user-specific list of actions facilitates analysis traceability of files.
- Electronic signatures
- Certify analysis and allow users to electronically sign reports with different statuses (e.g., “Reviewed” and “Approved”).
- Certify analysis and allow users to electronically sign reports with different statuses (e.g., “Reviewed” and “Approved”).
- Anonymization and encryption
- Enable sharing of files with another laboratory for second opinion or BD technical support while safeguarding privacy.
- Enable sharing of files with another laboratory for second opinion or BD technical support while safeguarding privacy.
- Auto-recover tool
- Allows safe recovery of files in the event of a computer or software crash.
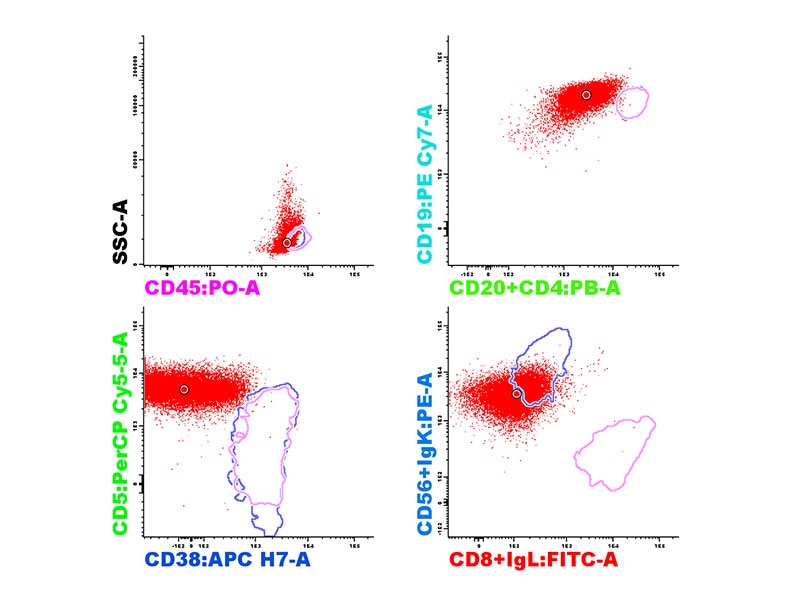
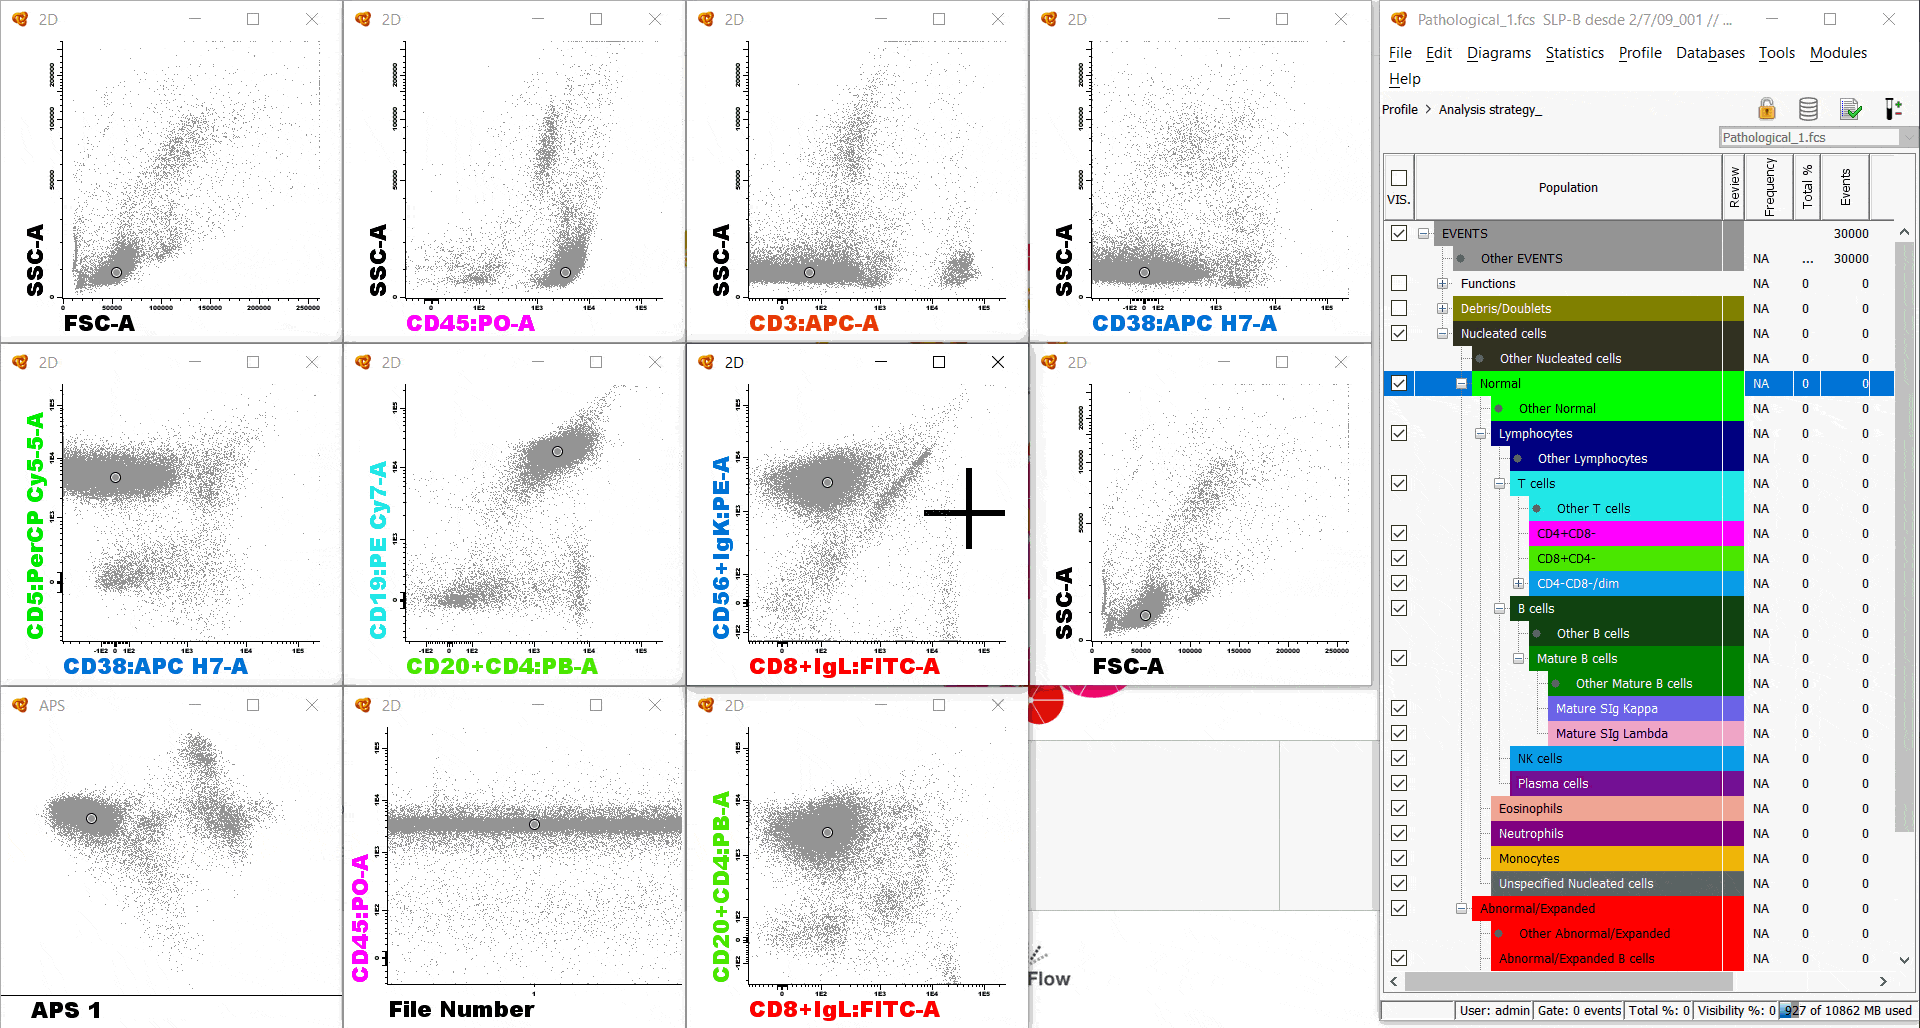
Analysis strategy and reference image
Analysis Strategy – Save a reusable workflow that includes diagrams, gating, stats, reference images, and report layouts. Ideal for specific panels or sample types to ensure consistent analysis across files.
Reference Image – An annotated diagram from a reference sample that can overlay new cases for quick comparison, highlighting deviations and supporting quality control.
Automatic Population Separation
APS (Automatic Population Separator) is a multiparametric tool that uses Principal Component Analysis (PCA) to separate cell populations based on all measured parameters simultaneously, rather than just two at a time like traditional dot plots.
Clustering
Clustering groups similar events into clusters based on their multiparametric profiles, helping identify cell populations without manual gating.
File merging
File merging combines multiple FCS files into a single dataset for integrated analysis. This is useful for panels split across tubes or when consolidating data from different runs.
Maturation
The Maturation tool evaluates the developmental stage of cell populations by comparing their immunophenotypic profiles to reference patterns. It’s commonly used in hematology and immunology to assess normal vs. abnormal maturation.
Contact Us
*Required fields
For Research Use Only. Not for use in diagnostic or therapeutic procedures.