The latest trends and best practices in high-dimensional flow cytometry
From the growing role of artificial intelligence to advances that enable truly multiomic analyses, high dimensional flow cytometry is revolutionising what researchers conducting basic, clinical and translational research can achieve.
In this article we walk through a few of the latest studies that the BD team is excited about, review a few best practices tips for generating reliable high-dimensional flow cytometry data, and discuss what we think is coming next in this rapidly expanding field.
Current trends in high-dimensional flow cytometry
Actionable insight from multiomics approaches
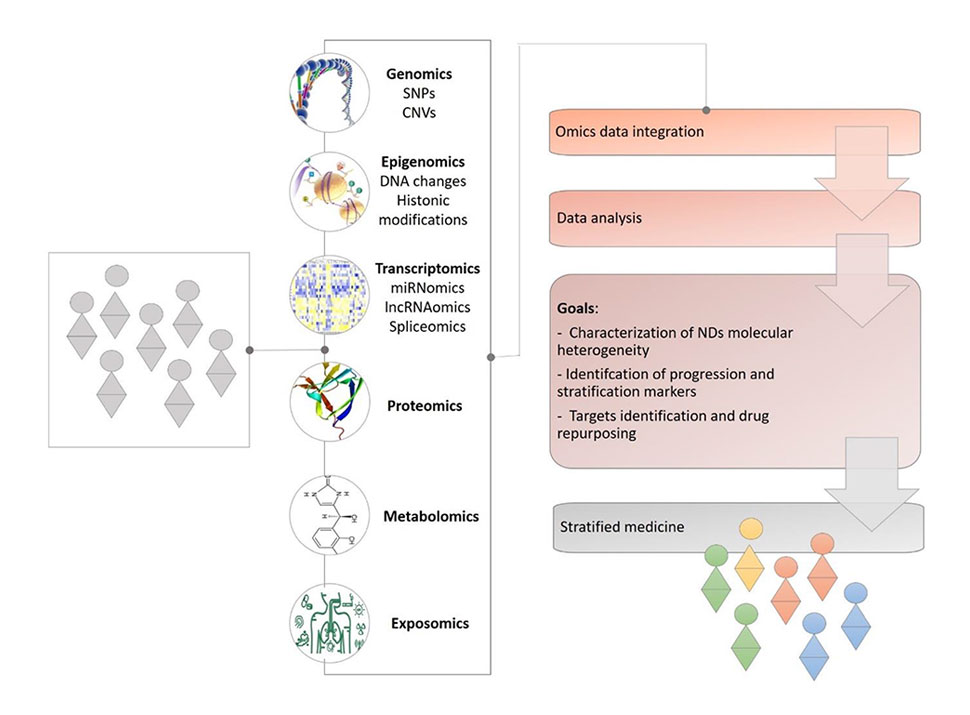
Over the past decade, advances in technology have given researchers the ability to take a holistic approach to studying human health and disease, integrating multiple omics datasets to reveal disease signatures and identify biomarkers,1–5 track cell lineages during development,6,7 and uncover insights that can’t be found from an analysis of a single type of biomolecule.
While much of this work has often involved the integration of transcriptomics with another genomic modality such as chromatin accessibility and DNA methylation, high-dimensional flow cytometry is starting to add a single-cell proteomics layer to the information on chromatin status and the state of the transcriptome.
Bringing greater clarity and molecular definition to an autoimmune disease
The paper:
A new molecular classification to drive precision treatment strategies in primary Sjögren’s syndrome1
Why you should care:
Like many autoimmune diseases, Sjögren’s syndrome is highly heterogeneous, has a poorly understood pathophysiology, and lacks diagnostic biomarkers that are both specific and sensitive.
In this comprehensive study, Soret, et al.,1 brought together genetic, epigenomic, transcriptomic, and high-dimensional flow cytometric data with multiplexed cytokine analysis, classical serological analysis, and clinical data in an effort to find subgroups of patients with shared molecular signatures.
What they did:
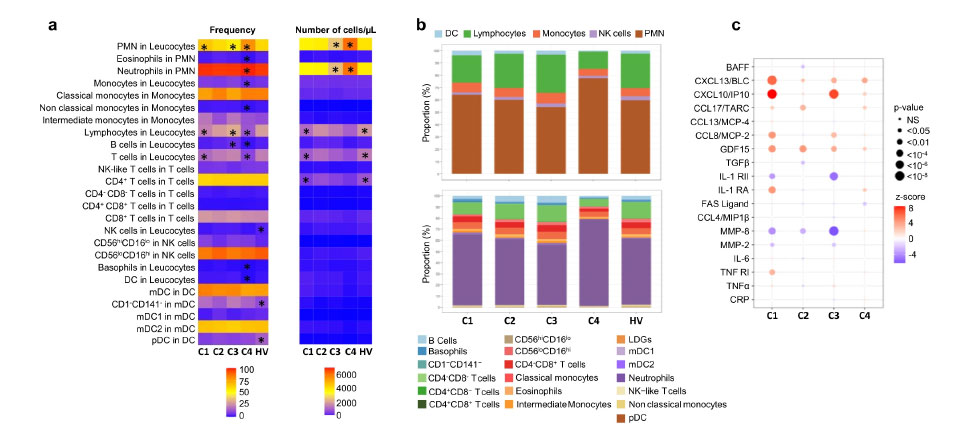
Using samples from over 300 patients and 330 matched healthy volunteers, they used transcriptomic analyses to cluster patients and found four distinct subgroups. Their additional genetic and epigenomic analysis provided insight into genomic dysregulation that may underlie disease pathology, with flow cytometry analysis enabling characterization of peripheral blood leukocyte subsets within each cluster.
What they found:
Soret, et al.,1 were able to cluster patients into four distinct subgroups with phenotypes that could help inform future therapeutic development.
Advanced algorithms to interpret high-dimensional data
Complex studies, like the one undertaken by Soret, et al.,1 are now possible thanks to the wide availability of computational methods for data analysis such as pre-built R and python packages, biology-specific programmes like SeqGeq™ Software, and flow cytometry-specific programmes like FlowJo™ Software. These approaches enable implementation of the latest clustering, machine learning, and artificial intelligence (AI) approaches.
Using clustering to identify biomarker signatures
In Soret, et al.,1 the authors analysed transcriptomics data using readily available software packages for unsupervised clustering (a consensus approach using Agglomerative Hierarchical Clustering, K-means clustering, and Gaussian mixture clustering) and supervised clustering that included random forest classification. This approach enabled them to define four distinct subgroups of patients and to identify the most discriminatory transcripts.
For clustering high-dimensional spectral flow cytometry data, Kreutmair, et al.,8 used FlowSOM9 along with uniform manifold approximation and projection (UMAP) for additional dimensionality reduction to identify immunological signatures that could discriminate between critical care patients who had SARS-CoV-2 and non-SARS-CoV-2 pneumonia.
Learn about the BD FACSymphony™ A5 SE Cell Analyzer that unlocks spectral flow cytometry capabilities with the quality you expect from a BD instrument
Classifying samples through direct analysis of raw flow cytometry data
While analysis of flow cytometry data is typically performed after manually defining cell subsets, this approach can miss critical information, such as cell marker correlations and rare cell populations, and can also introduce batch-to-batch variability.10 AI-based approaches using convolutional neural networks (CNN) are being advanced to analyse single cell flow cytometry data in implementations called CellCNN11 and deep CNN.12
Hu, et al., leveraged publicly available cytometry data sets to develop their deep CNN approach, which accurately diagnosed asymptomatic cytomegalovirus infection even though the datasets were highly heterogeneous.12 Even better, they developed a method to interpret the classification—a failing typical of AI approaches which do not provide insight into how they arrived at their classification decisions. With their permutation-based interpreter, Hu, et al., were able to identify the diagnostic biomarkers critical for the classification.12
Data analysis roundup: Tools for analysis of high-dimensional flow cytometry data
Visualising data
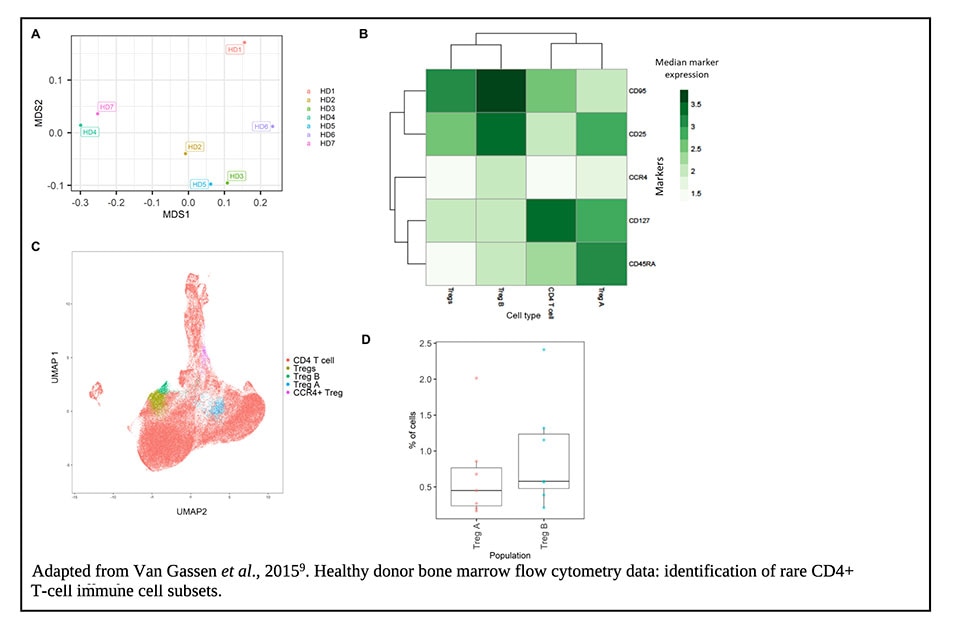
ImmunoCluster is a flexible open-source computation framework that is an R package and mainly focuses on the visualisation of high-dimensional flow cytometry data13. It constructs a hierarchy of biologically meaningful cell populations. This framework has the ability to incorporate novel computational methods in clustering and dimensionality reduction.
ImmunoCluster also offers an easier alternative for biologists to the other popular frameworks such as CATALYST and is successful in detecting clinically relevant changes in flow cytometry samples of both healthy individuals and patients.
Decreasing computational time
Time is of the essence when conducting high-level clinical research. T-distributed stochastic neighbour embedding (t-SNE) is time consuming for larger data sets and variations of this program are needed to cut down the computational run time. Approximated-t-SNE is a re-designed algorithm that reduces the time by approximating the distance between data points14.
Multicolour panels answering major research questions
There are a growing number of optimised multicolour immunofluorescence panels (OMIPs). The most recent ones show how high-dimensional flow cytometry is advancing our insight into biology.
Vaccine studies
The paper:
OMIP-056: Evaluation of Human Conventional T Cells, Donor-Unrestricted T Cells, and NK Cells Including Memory Phenotype by Intracellular Cytokine Staining15
Why you should care:
There is still a huge gap in designing effective vaccines against complex infectious pathogens such as HIV, tuberculosis (TB) and malaria. The lack of known immune correlates that play a role in pathogen protection in an impediment to this development.
What they did:
Dintwe, et al.,15 designed a 26-colour staining panel consisting of known immune markers that play a significant role in TB pathogenesis. They ran the samples successfully through a BD FACSymphony™ analyzer.
What they found:
This panel is unique as it is a novel combination of both functional and phenotypic markers and provides the immune correlates for TB. This panel design also worked on whole pathogens and recombinant proteins which is a revolutionary step in the quest for better vaccine strategies.
Infectious diseases
The paper:
OMIP-051: 28-Color Flow Cytometry Panel to Characterise B Cells and Myeloid Cells16
Why you should care:
This panel opens a new avenue in studying infectious diseases such as HIV-1 with the creation flow cytometry panel designed to describe a wide range of immune subsets to support a genome wide association study (GWAS).
What they did:
Liechti and Roederer designed a comprehensive 28-colour flow cytometry panel and revealed minute novel alterations in monocytes, B cells and dendritic cells including their subsets.16
What they found:
Interestingly, most of the markers in this OMIP showed very good cross-reactivity with peripheral blood mononuclear cells (PBMCs) from rhesus macaques.
Paediatric oncology
The paper:
OMIP-072: A 15-colour panel for immunophenotypic identification, quantification, and characterisation of leukemic stem cells in children with acute myeloid leukemia17
Why you should care:
Acute myeloid leukaemia (AML) patients have a minor subset of cells with leukaemia-initiating potential called leukaemic stem cells (LSCs) which can predict the cellular source of the leukaemia and also from where AML relapse can occur. Paediatric AML is a rare oncological disease and most research has been done in adult patients thus leading to a lack of information on paediatric LSCs lineage. Another challenge that is faced by oncologists is the amount of bone-marrow derived samples that can be obtained from a young patient.
What they did:
Petersen, et al., successfully created a single-tube approach by designing a 15-colour panel to capture the heterogeneity of LSCs in paediatric samples.17 Not only did they study the expression levels of the LSCs in AML patients but also evaluated cryopreserved mononuclear cells from healthy children as a positive control.
What they found:
The most exciting outcome of this study is that this panel can be used to assess LSCs not only from cryopreserved cells but any biological material containing hematopoietic cells and widens the area of research for AML.
Immuno-phenotyping
The paper:
OMIP-076: High-dimensional immunophenotyping of murine T-cell, B-cell, and antibody secreting cell subsets18
Why you should care:
There is a gap in understanding how downstream adaptive responses are associated with protection via innate immunity and this is of critical importance for disease pathogenesis and discovery of appropriate therapeutic interventions.
What they did:
Mincham, et al., designed a 19-parameter, 18-colour flow cytometry panel and ran murine tissues on a BD LSRFortessa™ characterising the immunophenotyping of two major B-cell, two antigen-specific cells (ASCs) and seven major T-cell populations within a single sample.18
What they found:
They were able to delineate T cell, B cell and ASC subsets in a comprehensive manner. The generation of this high-throughput data is groundbreaking as this panel can detect all these major immune cell populations simultaneously and in a single tube.
Learn more about how BD is enabling deeper insights into biology through high-dimensional flow cytometry
Best practices for generating reliable high-dimensional data
For scientists who are new to high-dimensional flow cytometry and would like to use this powerful technique for your own research questions, we have assembled a few tips and tricks for generating reliable results.
Minimise variability
As with any biological study where sample-to-sample variability is a given, minimising variability from factors you can control can be critical for detecting small signals and rare populations.19
- Power your study adequately.20 Make sure you have enough samples to see statistically significant effects in your data.
- Obtain enough reagents for your study to avoid using multiple batches. Consider fluorescent cell barcoding and pooling reagents, if feasible, to further avoid introducing batch effects.
- Create standardised operating procedures for sample collection and processing, instrument settings, and data analysis.
- If possible, process samples quickly followed by immediate staining and analysis
- Ensure all equipment such as pipettes, automated liquid handlers, and flow cytometers, are properly calibrated for your assay and reagents.
- Randomise samples when assigning different experimental groups to minimise the introduction of bias from non-biological factors.
- Run appropriate controls for calculating a compensation matrix to account for spillover effects
Optimise panel design
With high-dimensional flow cytometry, optimising panel design is critical for obtaining good data, but can also be a challenging activity. Key factors that can affect panel performance include:
- Biology—Antigen density and co-expression
- Fluorochrome—Brightness and spillover
- Instrument—Configuration and set-up
Check out the resource hub with videos and other resources for multicolour flow cytometry panel design the BD team has put together
Pre-process data and run quality control checks
Ensure your data is properly pre-processed and transformed to maximise the accuracy of your results.
- Calculate a compensation matrix to account for signal crosstalk across detection channels.
- Transform your data to ensure a normal distribution and optimise for your specific samples and markers using a tool like flowTrans or flowVS.
- Check and adjust for signal quality
- Extract cellular barcode information and perform dead cell and debris gating
- Create two-dimensional summaries of the data for better visualisation before further analysis
- Include a combination of dimensionality reduction and clustering algorithms in parallel to map cluster identities using colour. This can identify populations of cells along with the data presentation at a single cell level.
Assemble a robust visualisation and feature analysis pipeline
With a large number of options for clustering and sample classification, make sure to choose a set of tools that will address your research question and can handle the dimensionality of your data.
New discoveries on the horizon
One constant in the dynamic world of flow cytometry is that there are always new instruments and new algorithms on the horizon that will power biological discovery and innovative clinical approaches. We’ve already covered some of these exciting advances earlier in this article and we expect to see a growing number of studies using multiomics approaches, spectral flow cytometry, and AI-based algorithms. We are also looking forward to more studies using AI-based approaches for direct analysis of flow cytometry data as well as the translation of these approaches into the clinic.
Whatever your interest is in high-dimensional flow cytometry—whether you are already an expert experimentalist or just learning more about the approach—we hope you’ve been able learn something new from this article and we look forward to seeing your work at the next conference and in the literature.