
Antigen density in flow cytometry
November 14, 2022
Antigen density in science
Antigen density is the level of expression of a marker in a cell. The knowledge of antigen density is crucial for many applications in immunology. Studies have revealed that the density and distribution of markers on the surface of cells can have a profound impact on the mechanism and binding of antibodies to them, as well as on the immune response.1
Antigen density and its importance in flow cytometry
Antigen expression levels may vary depending on the cell type. In a flow cytometry experiment, it is crucial to know the expression level of the antigen being studied in the cell population of interest.
This is necessary so that the appropriate fluorochromes can be assigned to their respective antibodies in the panel.
Based on antigen expression level, antigens can be classified as:2
- Primary antigens: These are expressed in high levels, and often define the cell lineages. They are easily classified as positive or negative. Examples: CD3, CD4, CD19.
- Secondary antigens: These are well characterised and typically expressed in higher densities, often over a continuum. Examples: CD27, CD28, CD45RA, CD45RO.
- Tertiary antigens: These are critical markers that are expressed in low density. They may vary upon activation. Antigens with unknown expression levels also fall in this category. Examples: CD25, STAT5, FoxP3.
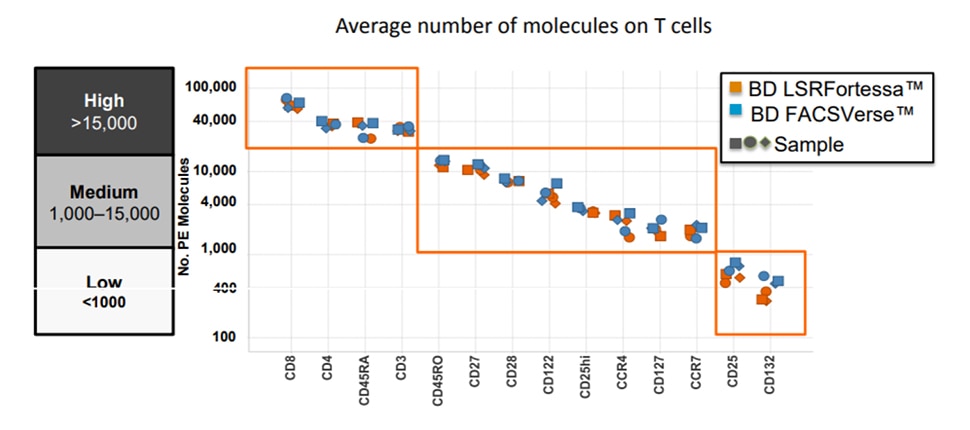
In a flow cytometry experiment, it is also important to know which markers are co-expressed, and what their corresponding antigen densities are. When evaluating antigen densities, it is often useful to group antigens based on their relative levels of expression (Figure 1).
Choice of fluorochromes
As a general rule, bright fluorochromes must be used for less expressed (low density) antigens and dim fluorochromes for highly expressed (high density) ones.
Bright fluorochromes generally provide better resolution but can also create excessive spillover into other detectors if used for highly expressed antigens.
Fluorochromes must be selected in such a way that antigens of all expression levels can be resolved and spectral overlap minimised. Tools like the BD Spectrum Viewer can be used to determine appropriate filters to detect a fluorochrome as well as fluorochrome compatibility and spillover. Unlike a static image showing excitation and emission histograms, this tool will demonstrate how a fluorochrome will have the same emission profile—but have varying brightness—based on the excitation wavelength of the laser.
Learn about the BD range of fluorochromes
Discover the relative brightness of BD fluorochromes