See what you sort.
Sort what you see.
Listen to the conversation between Jochen Lamote, PhD and Jochen Behrends, PhD about BD CellView™ Image Technology. How BD CellView™ Image Technology is chaning their research?
- Seeing is believing means you have a new perspective on the dots in your plots, increasing your sorting confidence.
- Whether you are improving existing applications or developing new ones, CellView is there to address your scientific questions.
- Where the signal originate is the key to develop new applications in various fields.
Want to see more case studies?
See the Data in Action
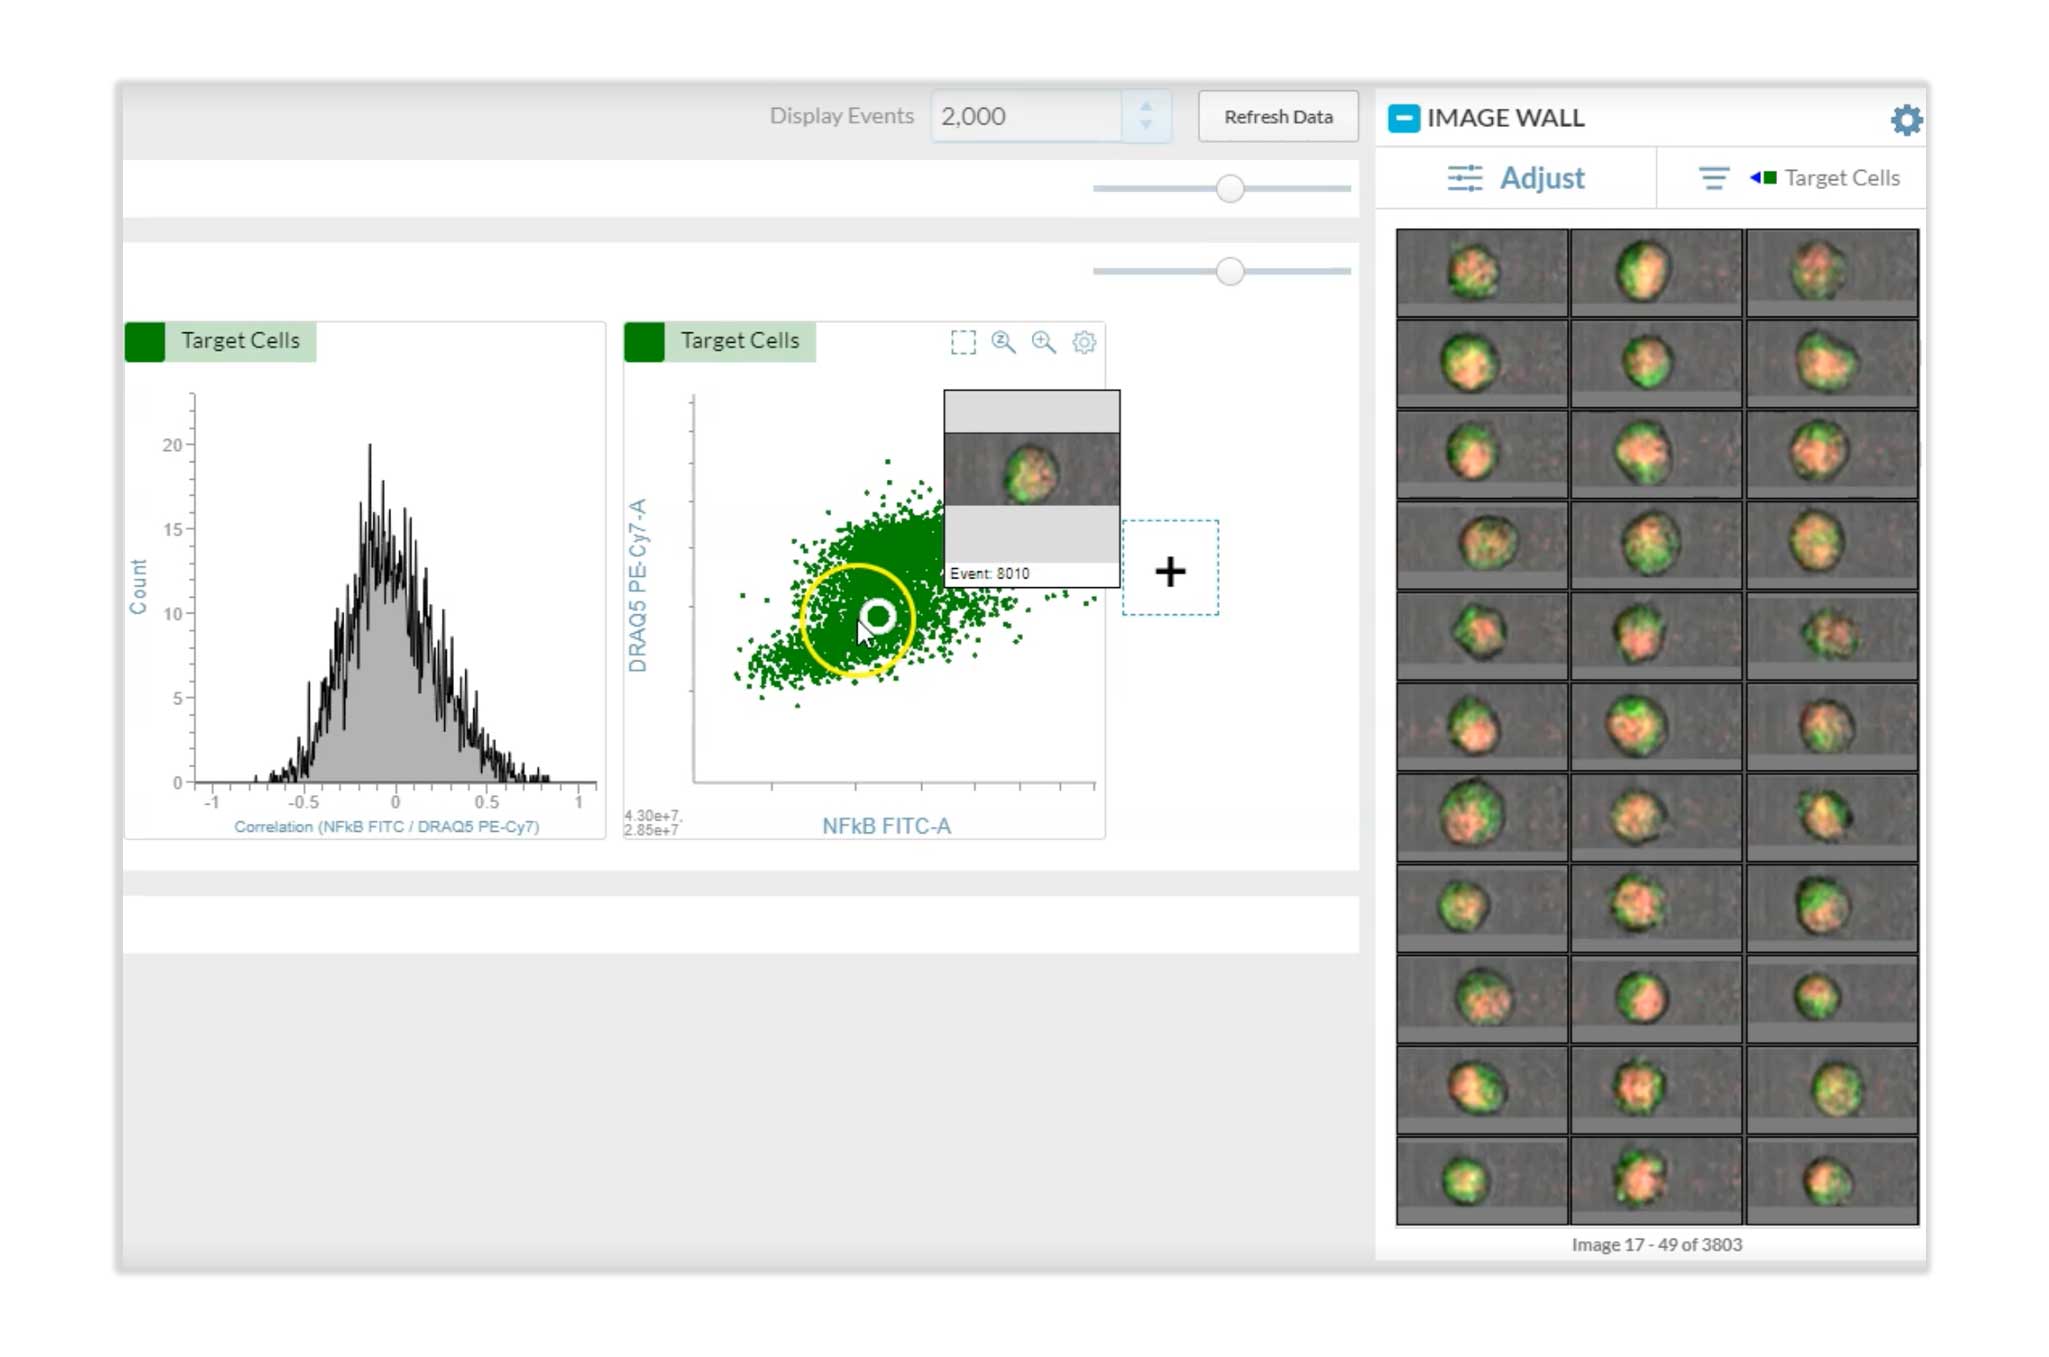
Get a sneak peek on how you can directly interact with image data in real time on a flow cytometer.
Image and flow data on each event are seamlessly integrated. You can easily view the image for an event by mousing over a dot on any scatter plot, even during acquisition. There is an image wall feature that allows you to look at images of all the events within a gate. While the sample is running, the image wall will update in real time to display the last 50 events that were analyzed.
BD CellView™ Image Technology
Single-cell Imaging that Is Faster than Anything Seen
Our proprietary technology enables imaging so fast, you can even use it to sort.
Unlike other technologies that combine imaging and flow cytometry, BD CellView™ Image Technology does not use a camera to image cells. This technical distinction is important because it enables imaging at much faster rates.
Previous imaging flow cytometry utilized camera-based technologies that require closely controlled fluidics. The strict fluidic requirements mean that these technologies have not been demonstrated with high-speed droplet cell sorting.
BD CellView™ Image Technology can perform camera-free imaging that is not limited by these fluidic requirements, allowing for throughput faster than other commercially available technologies that incorporate imaging into flow cytometry. More excitingly, it can enhance fluorescence activated cell sorting (FACS) with live visual inspection of target cells and novel gating strategies based on real-time image feature analysis using spatial distribution of fluorescence–capabilities that cannot be found with any cytometer on the market.
Visualize the Difference
with Imaging Flow Cytometry

Results with Confidence
Ensure the validity of your data on cell populations through accurate image-informed gating and real-time visual verification of individual cell characteristics.

New Capabilities
Expand your research by leveraging flow cytometry with precise, high-throughput analysis of key image features and high-speed sorting of cells based on image features and traditional flow parameters.

Comprehensive Analysis
Build large-scale datasets, connecting individual cell phenotype and morphology to downstream molecular insights with flow data that seamlessly integrate image analysis.
BD CellView™ Image Technology Can Be Used for a Wide Range of Applications
Gate and Sort with Quantitative Image Features in the Same Way You Do with Flow Parameters.
By enhancing the performance of flow cytometry analysis and sorting, our novel technology enables the application of flow cytometry in fields beyond immunology including oncology, cell biology, plant biology, microbiology and genomics. Easily gate and sort with image features that are visualized in familiar dot plots and histograms. Spatial and morphological insights on scatter and fluorescent signals enable assays for:
- Subcellular structural elements (organelles)
- Internalization and trafficking
- Cell-to-cell interactions (cancer cell killing and immune synapse)
- Deeper DNA and cell analysis division, and more
“We’ve been longing for years to have fast, robust and fluorescence enabled single-cell imaging integrated into a standard flow cytometer that would allow us to picture the cell and provide spatial information. This is exactly what BD CellView™ Image Technology achieves – pairing its reliable high-end cytometry technology with a very clever way of generating imaging parameters on the fly.”
Dr. Malte S. Paulsen
Head of Scientific Platforms at the Novo Nordisk Foundation Center for Stem Cell Medicine and previous Head of Flow Cytometry at EMBL Heidelberg
BD CellView™ Image Technology Early Access User

Our latest innovation leverages widely used technology from the wireless communication industry to enable high-speed cell imaging.
By implementing orthogonal frequency domain multiplexing, BD CellView™ Image Technology is able to image cells with the electronic and optical components used in flow cytometers. This unique technology makes it possible to produce images without a camera, enabling imaging at unprecedented real time speed. Image data are acquired and quantified so quickly that users can interact with them in real time for analysis and sorting as the sample is running–something that has never been possible before.

Eccentricity
Eccentricity is a ratio of the shortest to the longest axis of the identified particle (as identified by the region of analysis)
Usage examples: Doublet discrimination, cluster identification
Availability: All imaging channels

Max Intensity
Max intensity is the intensity of the brightest pixel in the image. It is not affected by the region of analysis.
Usage examples: Punctate fluorescence, phagocytosis assay, cell cycle analysis
Availability: All imaging channels

Size
Size is the number of pixels in the image, which are brighter than a user-defined pixel threshold.
Usage examples: Label-free sorting, punctate fluorescence
Availability: All imaging channels

Radial Moment
Radial moment is the average distance of the pixels from the centroid within the region of analysis.
Usage examples: Doublet discrimination (with Eccentricity), cell—cell interactions (cellular synapse)
Availability: All imaging channels

Correlation
Correlation is the degree to which the location of two imaging channels are the same within the region of pixels defined by the region of analysis.
Usage example: Translocation assay
Availability: Any two imaging fluorescence channels

Delta Center of Mass
The distance between two fluorescent signal sources in any two imaging channels within a particle as defined by the region of analysis.
Availability: Any two imaging channels

Forward Scatter (FSC)
As particles (cells) pass through the laser, the interaction of the light with the particle results in scatter in all directions.
The forward scatter detector is placed in line with the laser path to measure light that is scattered at small angles. forward scatter loosely correlates to particle (cell) size.
")
Side Scatter (SSC)
As particles (cells) pass through the laser, the interaction of the light with the particle results in scatter in all directions.
The side scatter detector measures light that is scattered perpendicular (90°) to the laser path. Side scatter loosely correlates to optical density or complexity of the particle.
")
Light Loss (Imaging)
As particles (cells) pass through the laser, the interaction of the light with the particle results in scatter in all directions.
Light loss is a measure of light (photons) lost from the laser due to scattering and absorption of light by a particle (cell).
")
Use image features to measure the relative location of fluorescence signals and track morphological changes in cell populations
HT-1080 fibrosarcoma cells were treated with TNF-a and then subsequently fixed, permed and stained for p65 (NFκB) using a secondary FITC-labeled antibody. The cells were then counterstained with the DNA stain DRAQ5™. BD CellView™ Image Technology enables the measurement of the relative spatial correlation between the NFκB FITC signal and the DNA DRAQ5™ signal. A correlation score of 1 indicates that both signals occupy the same space spatially.
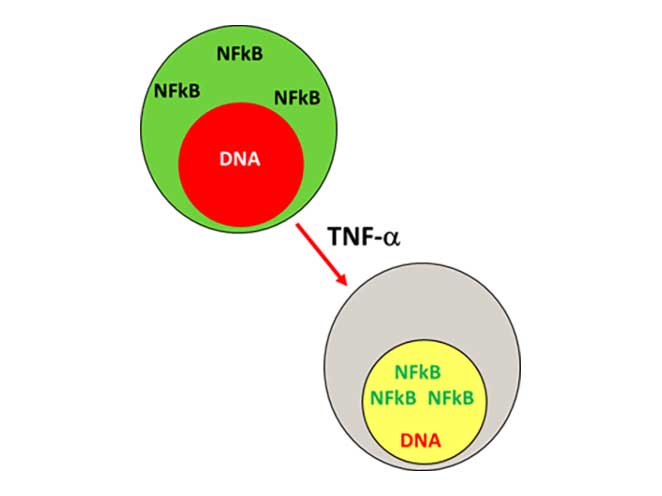
Real-time image feature analysis measures the spatial correlation between two fluorescent signals.
-DNA-Thumbnail.jpg)
TNF-a titration of HT-1080 fibrosarcoma cells demonstrates varying degrees of translocation. The correlation score measures the relative degree of translocation.
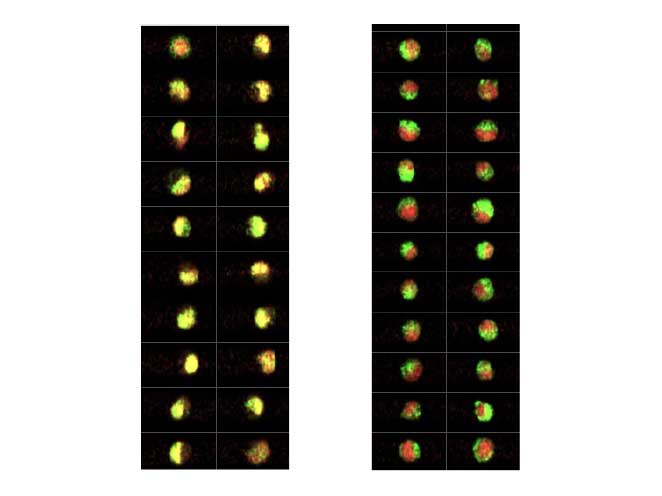
Increasing concentrations of TNF-a induce translocation of NFκB from the cytoplasm into the nucleus. The green fluorescence signal of NFκB and the red fluorescence signal of the DNA merge to appear yellow.
Measuring translocation:
HeLa cells expressing fluorescently tagged NFκB with DRAQ5™ DNA counterstain

For Research Use Only