![](/etc.clientlibs/bdb-aem/clientlibs/clientlib-base/resources/icons/blankimage.png)
Old Browser
This page has been recently translated and is available in French now.
Looks like you're visiting us from {countryName}.
Would you like to stay on the current country site or be switched to your country?
Overview
The BD Rhapsody™ Assay for Transposase-Accessible Chromatin assay (ATAC-seq) enables you to either reproducibly generate standalone open chromatin profiling data or perform a multiomic analysis of open chromatin accessibility and transcriptome of single cells in one experiment on the BD Rhapsody™ Single-Cell Analysis System.
The BD Rhapsody™ ATAC-Seq Assays enable you to either generate highly reproducible open chromatin profiling data from single cells or perform a multiomic analysis of open chromatin accessibility and transcriptome of single cells in one experiment using the BD Rhapsody™ Single-Cell Analysis System.
Learn more from the BD Rhapsody™ ATAC-Seq Assay Brochure.
![](https://www.bdbiosciences.com/content/dam/bdb/products/reagents/single-cell-multiomics-reagents/atac-seq/ATAC-Seq-Product-Image.jpg)
Why Choose BD Rhapsody™ ATAC-Seq?
-
Unlock Chromatin Secrets: uncover a new layer of biology within chromatin accessibility patterns, gene regulation, and epigenetic dynamics - all on the same cell and with a wide range of cell inputs. -
Enhance cost Efficiency: the BD Rhapsody™ ATAC-Seq Assay has been designed to be cost-effective without compromising quality. -
Next-Level Insights: with our BD Rhapsody™ Single-Cell Multiomic ATAC-Seq Assay, you will reveal gene regulation networks with great sensitivity and specificity. -
Sample Tagging Enabled: compatibility with Custom BD® Nuclear Antibody-Oligonucleotide Conjugates allows to combine and simultaneously process multiple samples in one single reaction, further optimizing costs.
Features
Validated on the new BD Rhapsody™ Enhanced Cell Capture Beads V3, BD Rhapsody™ ATAC-Seq Assays generate consistent, high-quality data across different samples and users and a wide range of cell inputs. Key features include:
- High sensitivity and specificity across different experimental conditions
- Capable of accommodating a wide range of cell inputs
- Integrated epigenomic and transcriptomic characterization on the same cells
- Compatibility with Custom BD® Nuclear Antibody-Oligonucleotide Conjugates
![Unveil Epigenomic Heterogeneity With Great Precision](https://www.bdbiosciences.com/content/dam/bdb/products/reagents/single-cell-multiomics-reagents/atac-seq/features/slide-1/Unveil-Epigenomic-Heterogeneity-With-Great-Precision.jpg)
Unveil Epigenomic Heterogeneity with Great Precision
![Unveil Epigenomic Heterogeneity With Great Precision](https://www.bdbiosciences.com/content/dam/bdb/products/reagents/single-cell-multiomics-reagents/atac-seq/features/slide-1/Unveil-Epigenomic-Heterogeneity-With-Great-Precision.jpg)
Sensitivity and specificity metrics for the BD Rhapsody™ Single-Cell ATAC-Seq Assay.
![Ties Between Gene Regulation and Expression at Single-Cell Level](https://www.bdbiosciences.com/content/dam/bdb/products/reagents/single-cell-multiomics-reagents/atac-seq/features/slide-2/Ties-Between-Gene-Regulation-and-Expression-at-Single-Cell-Level.jpg)
Uncover Ties Between Gene Regulation and Expression at the Single-cell Level
![Ties Between Gene Regulation and Expression at Single-Cell Level](https://www.bdbiosciences.com/content/dam/bdb/products/reagents/single-cell-multiomics-reagents/atac-seq/features/slide-2/Ties-Between-Gene-Regulation-and-Expression-at-Single-Cell-Level.jpg)
Sensitivity and specificity metrics for the BD Rhapsody™ Single-Cell Multiomic ATAC-Seq Assay.
![Reproducible Results Across Different Samples and Studies](https://www.bdbiosciences.com/content/dam/bdb/products/reagents/single-cell-multiomics-reagents/atac-seq/features/slide-3/Reproducible-Results-Across-Different-Samples-and-Studies.jpg)
Reproducible Results Across Different Samples and Studies
![Reproducible Results Across Different Samples and Studies](https://www.bdbiosciences.com/content/dam/bdb/products/reagents/single-cell-multiomics-reagents/atac-seq/features/slide-3/Reproducible-Results-Across-Different-Samples-and-Studies.jpg)
High reproducibility with BD Rhapsody™ ATAC-Seq Assays
![Generate Consistent Data Across Cell Inputs](https://www.bdbiosciences.com/content/dam/bdb/products/reagents/single-cell-multiomics-reagents/atac-seq/features/slide-4/Generate-Consistent-Data-Across-Cell-Inputs.jpg)
Generate Consistent, High-quality Data Across a Wide Range of Cell Inputs
![Generate Consistent Data Across Cell Inputs](https://www.bdbiosciences.com/content/dam/bdb/products/reagents/single-cell-multiomics-reagents/atac-seq/features/slide-4/Generate-Consistent-Data-Across-Cell-Inputs.jpg)
Robust performance across different cell input amounts.
![](/etc.clientlibs/bdb-aem/clientlibs/clientlib-base/resources/icons/blankimage.png)
Applications
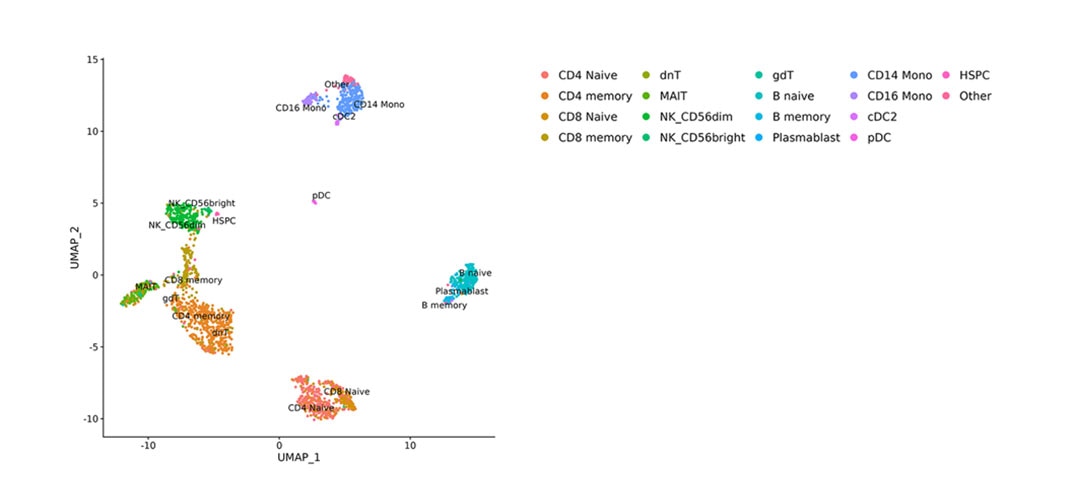
In this study, the BD Rhapsody™ Single-Cell Multiomic ATAC-Seq Assay was used to analyze 2,190 nuclei from human peripheral blood mononuclear cells (PBMCs). A joint whole transcriptome analysis (WTA) and ATAC-seq dimensionality reduction was performed by Uniform Manifold Approximation and Projection (UMAP) and cells were annotated as members of distinct cell types using the WTA data from a PBMC reference atlas.
![Joint WTA ATAC-Seq Dimensionality Reduction](/content/dam/bdb/products/reagents/single-cell-multiomics-reagents/atac-seq/applications/slide-1/Joint-WTA-ATAC-Seq-Dimensionality-Reduction-Thumbnail.jpg)
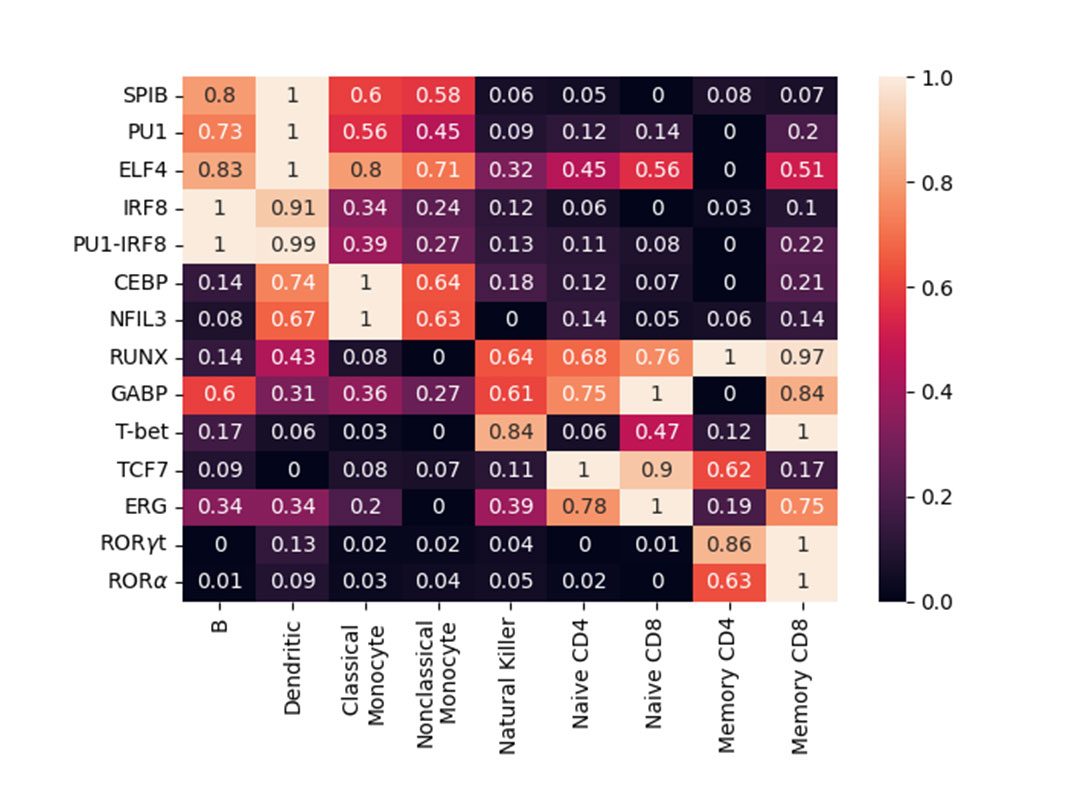
The heat map shows normalized enrichment scores of cell type–specific transcription factor motifs. Motif scores were calculated using a binomial distribution, determining the relative enrichment of each motif in differentially accessible regions of a given cell type compared to GC-matched background regions. The scores were then normalized across cell types per motif on a 0–1 scale, where 0 indicates least enrichment and 1 indicates highest enrichment of each motif.
![Cell Type Specific Transcription Factor Motif in PBMC](/content/dam/bdb/products/reagents/single-cell-multiomics-reagents/atac-seq/applications/slide-2/Cell-Type-Specific-Transcription-Factor-Motif-in-PBMC-Thumbnail.jpg)
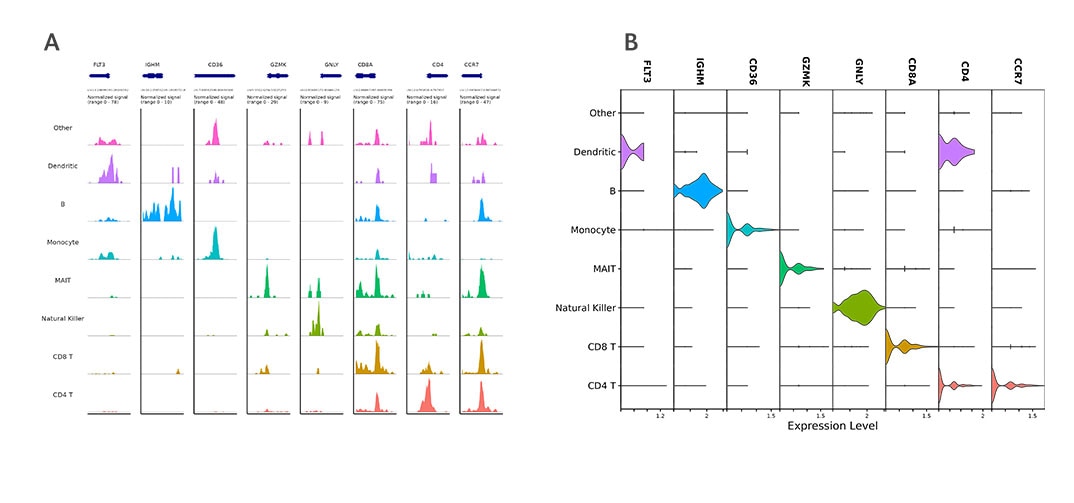
A. Read density across each ATAC-seq cluster at the transcription start sites of cell type marker genes.
B. Violin plots showing cell type-specific gene expression in WTA data.
![Single-Cell ATAC-Seq Data vs WTA Data in PBMCs](/content/dam/bdb/products/reagents/single-cell-multiomics-reagents/atac-seq/applications/slide-3/Single-Cell-ATAC-Seq-Data-vs-WTA-Data-in-PBMCs-Thumbnail.jpg)
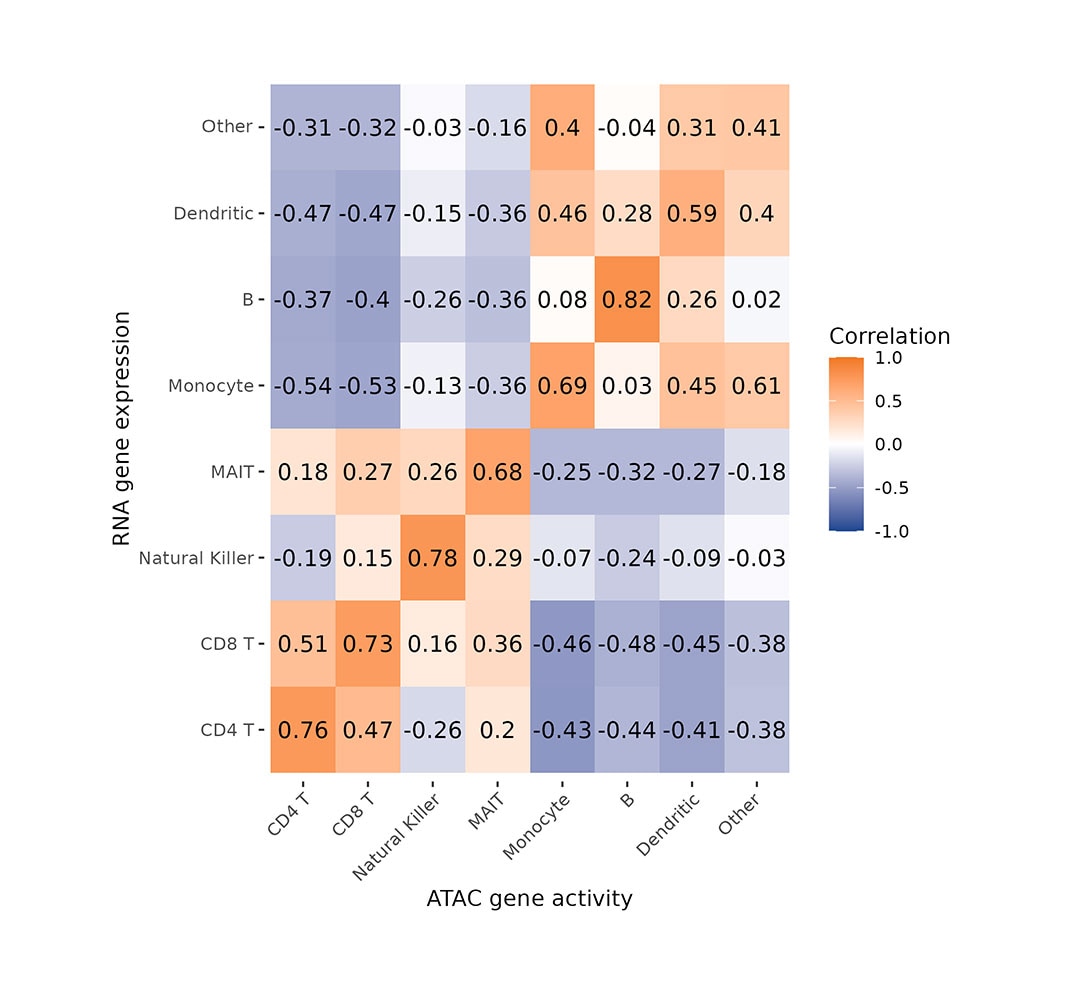
This heatmap shows Pearson’s correlation coefficients between ATAC-seq gene activity scores and gene expression values in PBMCs, with each row representing a cell type in WTA data and each column a cell type in ATAC-seq data.
![Gene-Expression and Inferred Gene Activity Score Concordance](/content/dam/bdb/products/reagents/single-cell-multiomics-reagents/atac-seq/applications/slide-4/Gene-Expression-and-Inferred-Gene-Activity-Score-Concordance-Thumbnail.jpg)
![](/etc.clientlibs/bdb-aem/clientlibs/clientlib-base/resources/icons/blankimage.png)
For Research Use Only. Not for use in diagnostic or therapeutic procedures.