Expand the Parameters of Possibility
BD offers a full suite of high-performance instruments, a comprehensive choice of fluorochromes, and advanced data analysis tools to help you every step of the way.
Regardless of your instrument of choice, a full overview of how you can accelerate your spectral flow is waiting.
Spectral vs conventional flow cytometry comparison
| Feature | Spectral | Conventional |
| Detector and fluorochrome ratio | More detectors than fluorochromes | 1:1 |
| Individual fluorochrome contribution determination | Unmixing | Compensation |
| Fluorochrome choice | Dependent on laser configuration | Dependent on laser and filter configuration |
| Autofluorescence extraction | Yes | No |
| Resolution of highly similar fluorochromes | Yes | No |
| Multi-color panel capability | 50+ colors | ~28 colors |
Introduction to spectral flow cytometry
Watch the spectral flow cytometry videos below to explore various topics, such as the fundamentals of spectral and conventional flow cytometry, how you can use more fluorochromes per laser line using spectral flow cytometry, how to use spectral flow cytometry for increased panel size, and more.
Fundamentals of spectral versus conventional flow cytometry
The video addresses the following questions:
- What is spectral flow cytometry?
- What are the similarities and differences between conventional and spectral flow cytometry?
- How do you read spectral signatures?
- What is unique about spectral flow cytometry?
Autofluorescence unmixing
The video addresses the following questions:
- What is autofluorescence unmixing?
- How can autofluorescence impact biological resolution?
- What are cell-specific autofluorescence signatures?
Fluorochrome choice flexibility
The video addresses the following questions:
- How to select fluorochromes in either conventional or spectral flow cytometry?
- How does spectral flow cytometry support the use of more fluorochromes per laser line?
- What are the advantages of using spectral flow cytometry for fluorescent protein detection?
Increased panel size
The video addresses the following questions:
- How does spectral flow cytometry enable resolution of highly similar fluorochromes?
- What are the similarity index and guidelines for the use of highly similar fluorochromes?
- What are the specifics behind a 40-color multicolor spectral flow cytometry panel?
Tools and Considerations for the Design of Multicolor Spectral Flow Cytometry
Spectral flow cytometry is an established technology that has increased the power, flexibility and complexity of flow cytometry. This webinar addresses the fundamental similarities and differences between conventional and spectral flow cytometry and dives deeper into facts and misconceptions around the principles and tools for multicolor spectral flow cytometry panel design.
Watch the Webinar
Topics:
- What is spectral flow cytometry and what makes it unique
- Fundamental rules and tools for panel design common to conventional and spectral flow cytometry
- The do’s and don’ts of panel design specific to spectral flow cytometry
Panel Performance Matters
We’re ready to support your workflow from design to performance. Set your flow cytometry up for success.

Fluorochrome Performance Guide
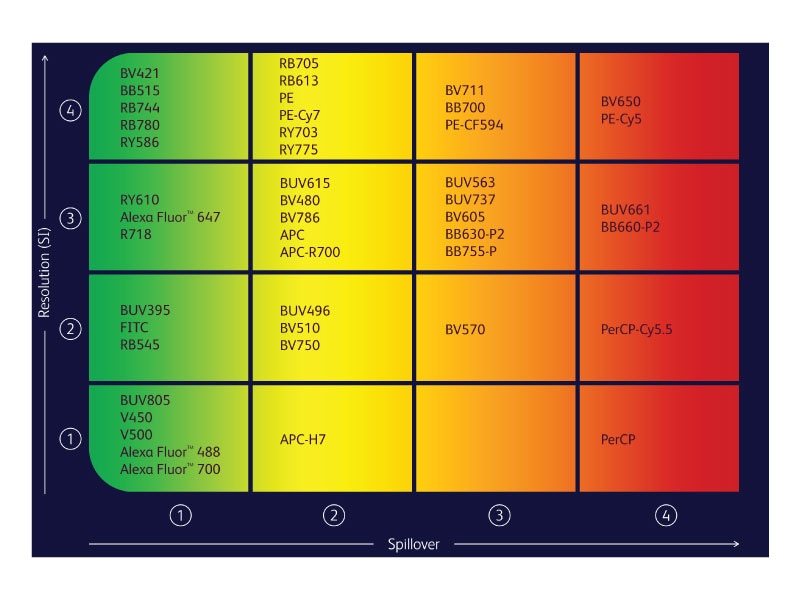
When building spectral flow cytometry assays, we are presented with hundreds of fluorochrome options. Differences in resolution and spillover can significantly impact panel resolution and data interpretation, which can make fluorochrome selection seem overwhelming and intimidating.
Simplify your panel design with our guide to choosing the right fluorochromes for you.
BD RealBlue™ Reagent Family
Knowing which fluorochrome to use for each marker in your panel and assigning them in a way that can lead to deeper biological insights can sometimes be difficult. Unlock New Insights with BD Horizon RealYellow™ and RealBlue™ Reagents! Dive into our laser-specific fluorochromes engineered to optimize your flow cytometry experiments. Discover how they enhance spectral positioning, reduce spillover, and streamline your research. Visit the page now and elevate your scientific discoveries!
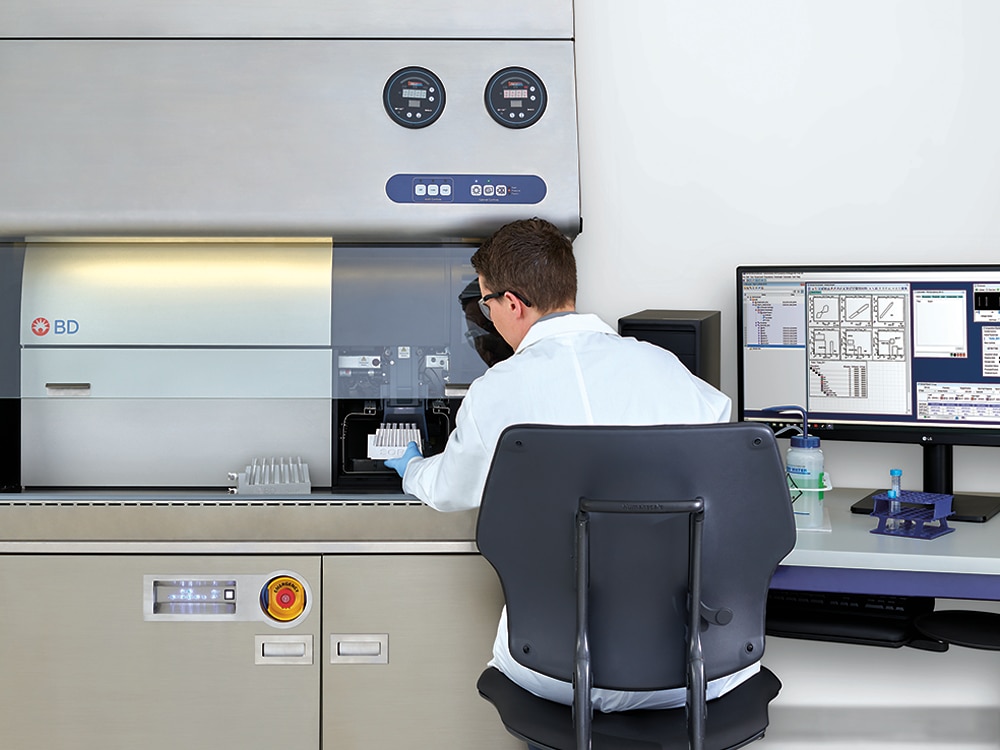
BD Biosciences offers cell analyzers and sorters that support both conventional and spectral flow cytometry
What is Spectral Cytometry
Spectral flow cytometry represents an alternative data acquisition and analysis strategy to conventional flow cytometry providing advantages in flexibility of fluorescent label inputs without having to change filters, as well as the ability to multiplex more fluorescent labels in one multicolor sample.
Increase your experimental capabilities
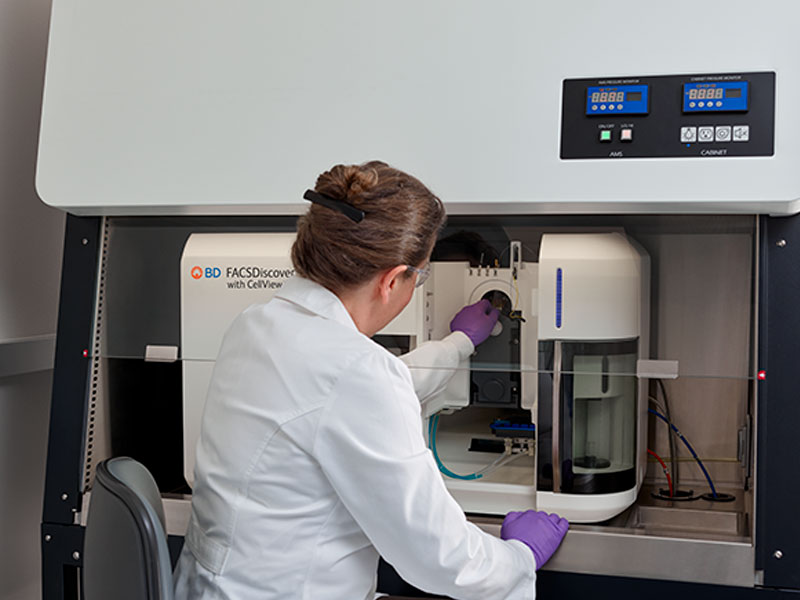
Image-enabled cell sorting & advanced spectral flow cytometry
The BD FACSDiscover™ S8 Cell Sorter combines spectral flow cytometry and real-time spatial and morphological insights, significantly expanding the power of cell analysis and sorting. Marking the first spectral flow sorter with sort-capable image analysis, the BD FACSDiscover™ S8 Cell Sorter opens up new pathways to scientific discovery, enabling access to information and insights that weren’t previously attainable.
Learn more in the BD FACSDiscover™ S8 Cell Sorter brochure.
Plan & manage your spectral experiment
BD® Research Cloud is a cloud-based software solution designed to integrate and facilitate flow cytometry experiments. Its flexible workflow functionality allows labs to create customized workflows for tracking collaborative experiments, and keep all the data, metadata and resources associated with an experiment in a single-site collaborative platform. With BD® Research Cloud , you can design your next flow cytometry panel on conventional or BD spectral cytometers; minimize the time spent moving data between systems; assign workflow steps and collaborate within the platform; manage your reagent inventory, titers and master mixes; and more. BD® Research Cloud integrates directly with FlowJo™ Software.
Build your panel with innovative dyes
BD Biosciences offers new panel design resources to help with these choices as well as a wide array of antibody specificities and fluorochromes for flexible and easy panel design.
Fast-track your journey to discovery and unleash the full potential of spectral flow cytometry with BD Biosciences.
From panel design expertise and a comprehensive spectrum of fluorochromes, to advanced data analysis tools, we can help at every step of the way. Our commitment is to offer you tangible solutions that not only enhance the precision of spectral flow cytometry but also accelerate your journey to discovery - no matter your instrument of choice.
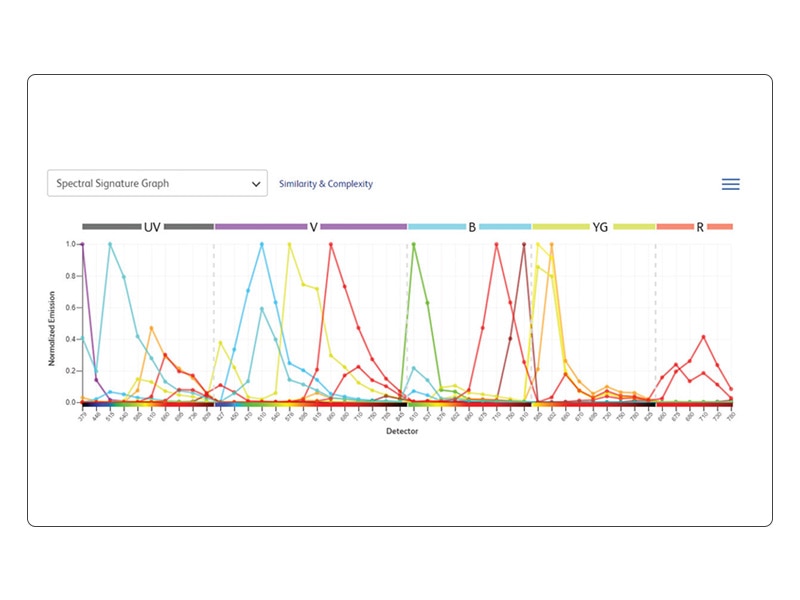
Explore new tools from BD Biosciences. The BD ® Spectrum Viewer is an interactive tool that helps you design optimal flow cytometry panels by allowing you to view and compare fluorochrome spectra, choose filters, and assess spillover. In the latest update, you can now access similarity and complexity indexes and visualise peak intensities of spectral signatures in a unique heat.
Apply your spectral panel & collect data
The BD FACSDiscover™ S8 Cell Sorter features BD CellView™ Image Technology and BD SpectralFX™ Technology, which expands panel size and flexibility with 78 fluorescent detectors across five lasers with algorithmically optimized bandpass filters. Insights on cell populations and characteristics can be visually confirmed in real time during analysis and sorting. Built-in visual inspection capabilities, more flexible panel design and automated features help to simplify your workflow, supported with correlation of downstream analysis with imaging and traditional flow data. Incorporating a high level of biosafety, the BD FACSDiscover™ S8 Cell Sorter was developed in partnership with The Baker Company.
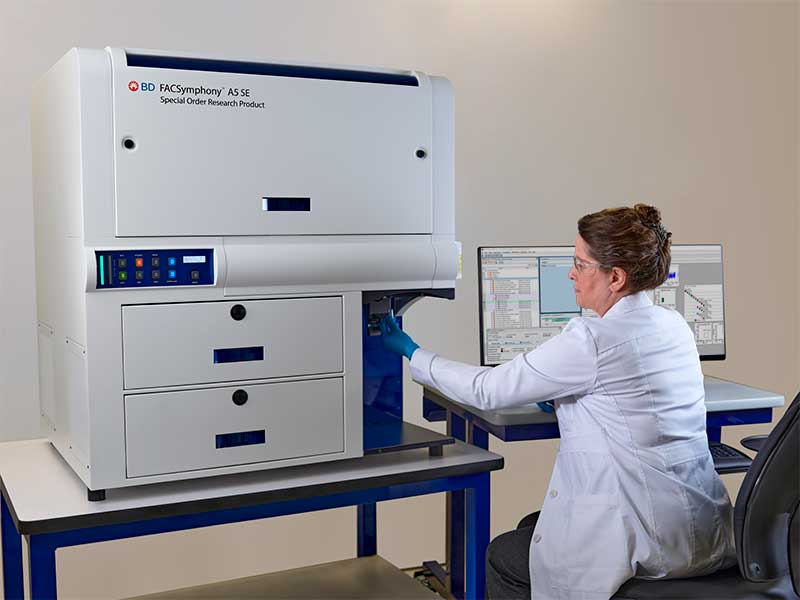
The BD FACSymphony™ A5 SE Cell Analyzer features five fixed-alignment lasers and 48 detectors for maximum coverage of the fluorochrome emission spectrum. By enabling both spectral unmixing and compensation-based workflows, the BD FACSymphony™ A5 SE Cell Analyzer increases flexibility in fluorochrome choices and permits simultaneous analysis of fluorochromes with similar spectral signatures. Spectral unmixing can also be used to resolve critical cell populations using autofluorescence unmixing.
The BD FACSymphony™ S6 Cell Sorter builds on the foundations of the BD FACSymphony™ A5 Cell Analyzer with easy migration of optimized panels from analyzer to sorter. The BD FACSymphony™ S6 Cell Sorter supports both conventional compensation and spectral unmixing methods, with flexibility for up to nine spatially separated lasers and 50 parameters. Together with bioinformatics analysis tools and the broad portfolio of BD high-parameter reagents, the BD FACSymphony™ S6 Cell Sorter provides an end-to-end solution for high-parameter experimental success.
Analyze
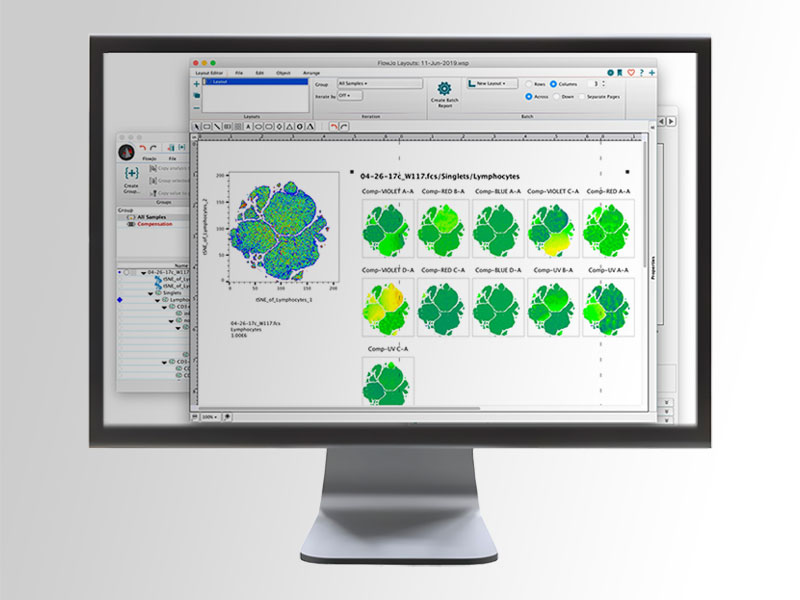
Featuring an intuitive interface, specialized analysis platforms and open-ended plugin architecture, FlowJo™ Software provides a powerful environment for single-cell flow cytometry analysis that can be used for immunophenotyping, cell cycle, proliferation, kinetics studies, quantitative population comparison or plate screening assays. Analyze any data file from any cytometer, using the intuitive drag-and-drop analysis and tools to analyze high-parameter data, and generate publication-quality graphics, all with FlowJo™ Software.
50-color spectral flow cytometry panel
In collaboration with researchers at the Fred Hutchinson Cancer Center, we developed a 50-color spectral flow cytometry panel on the BD FACSDiscover™ S8 Cell Sorter for the in-depth analysis of the immune compartment in human blood and tissues. The panel evaluates all the major immune cell subsets with a specific emphasis on phenotyping markers focused on the activation and differentiation status of the T cell and dendritic cell (DC) compartment.
33-color spectral panel sheet. Immunophenotyping and cell isolation with high-parameter spectral flow cytometry
Explore how spectral flow cytometry can address the rising demand for high-dimensional cell analysis, from characterizing cell phenotypes to sorting cell groups.
- A novel integration of spectral flow cytometry with real-time imaging
Advancing drug discovery by sorting cells based on their morphology and protein localization
Presented by Raffaello Cimbro, PhD, Director and Global Leader of Flow Cytometry from AstraZeneca (US/UK)
Revealing cellular diversity with the power of spectral cytometry
This webcast will review the principles and concepts of spectral flow cytometry, describe current technology innovations, and showcase some of the exciting discoveries made possible by spectral flow cytometry, while also discussing practical tips and best practices for researchers who want to adopt this technology.
BD Horizon™ NEXT Global Educational Tour Webinar Series
Optimize: Learn about tools and considerations for the design of multicolor spectral flow cytometry panels.
In this module you will learn the fundamentals of spectral and conventional flow cytometry, how you can use more fluorochromes per laser line using spectral flow cytometry, how to use spectral flow cytometry for increased panel size, and more.
BD Horizon™ NEXT Global Educational Tour Webinar Series
Deep Science: Exploring the diversity of immune systems through deep spectral immunotyping and cell sorting.
In this module, we will use the optimized 38-color human NK and T cell panel to demonstrate how experimental conditions (storage, freezing and sampling time) can affect biological resolution.
BD Horizon™ NEXT Global Educational Tour Webinar Series
Imaging Spectral Sorting: Learn about the cutting-edge technologies featured in the first ever real-time imaging, spectral flow cytometer.
In this module, we'll show how our next-generation instruments will include image-enabled sorting and spectral flow cytometry technologies. Learn more about new imaging parameters and how to take sorting to new levels, paving the way for researchers to address previously impossible-to-answer questions.
Real-time image feature extraction enables a range of novel flow cytometry cell sorting applications
Aaron Middlebrook, Sr. Staff Scientist, BD, will highlight real-time imaging (RTI)–enabled cell sorting applications, experimental design and panel considerations.
- Introduce you to RTI flow cytometry
- Demonstrate how to gate and sort with quantitative image features in the same way you do with flow parameters
- Illustrate how to apply image features for different applications to measure the relative location of fluorescence signals and track morphological changes in cell populations
Spectral Flow Fundamentals
Speaker: Peter Mage, Associate Principal Engineer, Advanced Technology Group, BD Biosciences. Gain a deeper understanding of spectral flow cytometry. Learn about:
- The relationship between conventional and spectral flow cytometry technology
- The difference between conventional compensation and spectral unmixing
- How to build an intuitive mental model for spectral flow cytometry that can help you understand your experiments and data in a new light
Deep immunophenotyping of murine lymphoid tissues using a 40-color spectral flow cytometry panel
Speaker: Aris Kare, Ph.D. candidate in the Departments of Bioengineering and Radiology at Stanford University, advised by Dr. Katherine Ferrara. Join us for a scientific talk by Aris Kare that will dive into their laboratory’s new publication [OMIP-095] covering a 40-color flow cytometry spectral experiment followed by an open Q&A and panel discussion to address key ingredients in successful spectral panel design and role of fluorochromes.
Elevating image-based sorting applications with spectral immunophenotyping
Speakers: Aaron Middlebrook, Sr. Staff Scientist, R&D Applications Lead, BD Biosciences, Peter Mage, Associate Principal Engineer, Advanced Technology Group, BD Biosciences. Learn about:
- Panel considerations for RTI-SFC
- Benefits and limitations of combining spectral immunophenotyping with imaging
- Maximizing data yield through computational analyses
For Research Use Only. Not for use in diagnostic or therapeutic procedures.
Alexa Fluor (AF) is a trademark of Thermo Fisher Scientific. Cy is a trademark of Global Life Sciences Germany GmbH or an affiliate doing business as Cytiva.