





.png)


Preparation And Storage


Recommended Assay Procedures
BD® CompBeads can be used as surrogates to assess fluorescence spillover (compensation). When fluorochrome conjugated antibodies are bound to BD® CompBeads, they have spectral properties very similar to cells. However, for some fluorochromes there can be small differences in spectral emissions compared to cells, resulting in spillover values that differ when compared to biological controls. It is strongly recommended that when using a reagent for the first time, users compare the spillover on cell and BD® CompBeads to ensure that BD® CompBeads are appropriate for your specific cellular application.
Product Notices
- Please refer to www.bdbiosciences.com/us/s/resources for technical protocols.
- Caution: Sodium azide yields highly toxic hydrazoic acid under acidic conditions. Dilute azide compounds in running water before discarding to avoid accumulation of potentially explosive deposits in plumbing.
- For fluorochrome spectra and suitable instrument settings, please refer to our Multicolor Flow Cytometry web page at www.bdbiosciences.com/colors.
- Please refer to http://regdocs.bd.com to access safety data sheets (SDS).
Companion Products
.png?imwidth=320)
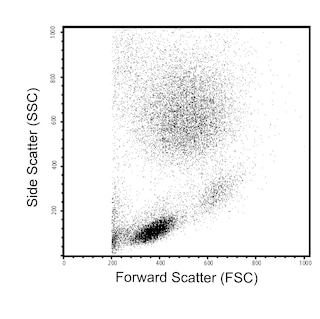
The OKT3 monoclonal antibody specifically recognizes the CD3 epsilon subunit (CD3e/CD3ε) of the CD3 complex which consists of four transmembrane proteins (γ, δ, ε, ζ) that are associated with the T cell antigen receptor (TCR) to form the CD3/TCR complex. The CD3 complex associates with either TCR αβ or TCR γδ heterodimers that are alternatively expressed by some thymocytes, T cells or NKT cells. The CD3 complex is required for the cell surface expression and signal-transducing functions of the TCR. The CD3 complex is expressed by ~60-85% thymocytes and by all peripheral mature T cells. CD3e is also known as T3E or TCRE. CD3e is a ~20 kDa unglycosylated type I transmembrane protein that is encoded by CD3E which belongs to the immunoglobulin superfamily (IgSF). CD3e has an Ig-like extracellular domain (ECD) and an immunoreceptor tyrosine-based activation motif (ITAM) in its cytoplasmic domain. The OKT3 antibody can reportedly fix complement, stimulate T cell proliferation and cytokine production, and block the binding of other human CD3e-specific antibodies including UCHT1 and SK7.
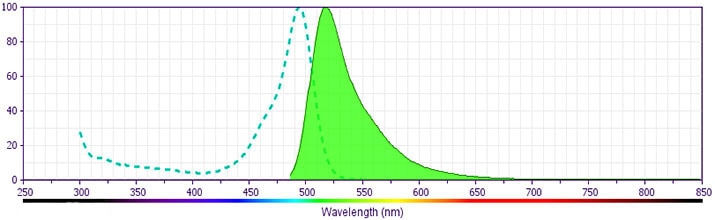
Fluorescein (FITC) is part of the BD blue family of dyes. This is a small organic fluorochrome with an excitation maximum (Ex Max) at 494-nm and an emission maximum (Em Max) at 518-nm. FITC is designed to be excited by the Blue laser (488-nm) and detected using an optical filter centered near 520 nm (e.g., a 530/30-nm bandpass filter). Please ensure that your instrument's configurations (lasers and optical filters) are appropriate for this dye.
Development References (12)
-
Burns GF, Boyd AW, Beverley PC. Two monoclonal anti-human T lymphocyte antibodies have similar biologic effects and recognize the same cell surface antigen. J Immunol. 1982; 129(4):1451-1457. (Clone-specific: Blocking, Functional assay, Immunoprecipitation, Radioimmunoassay). View Reference
-
Emmrich F. Selective stimulation of human CD4 and CD8 T-cells by crosslining the T-cell receptor with subset-specific differentiation antigens. In: McMichael AJ. A.J. McMichael .. et al., ed. Leucocyte typing III : white cell differentiation antigens. Oxford New York: Oxford University Press; 1987:203-206.
-
Ernst DN, Shih CC. CD3 complex. J Biol Regul Homeost Agents. 2000; 14(3):226-229. (Biology). View Reference
-
Horibe K, Knowles RW, Naito K, Morishima Y, Dupont B. Analysis of T lymphocyte antibody specificities: Comparison of serology with immunoprecipitation patterns. In: Bernard A. A. Bernard .. et al., ed. Leucocyte typing : human leucocyte differentiation antigens detected by monoclonal antibodies. Berlin New York: Springer-Verlag; 1984:212-224.
-
Kung P, Goldstein G, Reinherz EL, Schlossman SF. Monoclonal antibodies defining distinctive human T cell surface antigens.. Science. 1979; 206(4416):347-9. (Immunogen: Cytotoxicity, Flow cytometry, Radioimmunoassay). View Reference
-
Kurrle R, Seyfert W, Trautwein A, Seiler FR. T cell activation by CD3 antibodies. In: Reinherz EL. Ellis L. Reinherz .. et al., ed. Leukocyte typing II. New York: Springer-Verlag; 1986:137-146.
-
Li B, Wang H, Dai J, et al. Construction and characterization of a humanized anti-human CD3 monoclonal antibody 12F6 with effective immunoregulation functions.. Immunology. 2005; 116(4):487-98. (Clone-specific: Blocking, Flow cytometry). View Reference
-
Semnani R, Nutman TB, Corrado G, Hochman P, Shaw S, Van Seventer GA. Costimulation mediated by purified ICAM-1 and LFA-3 regulates differential stimulation and cytokine secretion of human 'naive' and 'memory' CD4+ T cells. In: Schlossman SF. Stuart F. Schlossman .. et al., ed. Leucocyte typing V : white cell differentiation antigens. Oxford: Oxford University Press; 1995:1488-1491.
-
Touraine JL, Favrot MC, Ansary ME, Cordier G, de bouteiller O. Phenotype of prothymocytes from human bone marrow determined by monoclonal antibodies: Modification induced by thymic factots. In: Bernard A. A. Bernard .. et al., ed. Leucocyte typing : human leucocyte differentiation antigens detected by monoclonal antibodies. Berlin New York: Springer-Verlag; 1984:298-311.
-
Tunnacliffe A, Olsson C, Traunecker A, Krissansen GW, Karjalainen K, de la Hera A. The majority of CD3 epitopes are conferred by the epsilon chain. In: Knapp W. W. Knapp .. et al., ed. Leucocyte typing IV : white cell differentiation antigens. Oxford New York: Oxford University Press; 1989:295-296.
-
Van Wauwe JP, De Mey JR, Goossens JG. OKT3: a monoclonal anti-human T lymphocyte antibody with potent mitogenic properties.. J Immunol. 1980; 124(6):2708-13. (Clone-specific: Functional assay). View Reference
-
Van Wauwe JP, Goossens JG, Beverley PC. Human T lymphocyte activation by monoclonal antibodies; OKT3, but not UCHT1, triggers mitogenesis via an interleukin 2-dependent mechanism. J Immunol. 1984; 133(1):129-132. (Clone-specific: Functional assay). View Reference
Please refer to Support Documents for Quality Certificates
Global - Refer to manufacturer's instructions for use and related User Manuals and Technical data sheets before using this products as described
Comparisons, where applicable, are made against older BD Technology, manual methods or are general performance claims. Comparisons are not made against non-BD technologies, unless otherwise noted.
For Research Use Only. Not for use in diagnostic or therapeutic procedures.
