Overview
BD FACSDiva™ Software is a collection of rich tools for flow cytometer and application setup, data acquisition, and data analysis that help streamline flow cytometry workflows for today's busy laboratory.
BD FACSDiva™ Software provides features to help users integrate flow systems into application areas, such as index sorting for stem cell and single-cell applications, as well as automation protocols for high-throughput and robotic laboratories.
BD FACSDiva™ Software provides robust features from setup through analysis
BD FACSDiva v9.0 Software:
Provides routine software operation features including overlays, undo/redo, and multiple copying and pasting of all worksheet elements.
The index sorting feature (available on BD Sorters Flow Cytometers) enables laboratories to sort cells into single wells of plates and identify them on dot plots, in statistics views and in a detailed results file.
BD FACSDiva™ Software v9.0 runs on the Microsoft™ Windows™ 10 64-bit operating system. A selected list of BD FACSDiva™ Software features is listed in the following specification table.
Specifications
| Feature | Specification |
|---|---|
| Cytometers Supported | BD FACSCanto™ 10-color, BD FACSCelesta™, BD FACSCanto™, BD FACSCanto™ II, BD FACSAria™ II, BD FACSAria™ III, BD FACSAria™ Fusion, BD® LSR II, BD LSRFortessa™, BD LSRFortessa™ X-20, BD FACSymphony™ S6, BD FACSymphony™ A3 and BD FACSymphony™ A5 |
| Options Supported | BD FACS™ Loader for the BD FACSCanto™ platforms, BD® High Throughput Sampler for the BD FACSCanto™ and BD® LSR platforms, and BD FACS™ Accudrop for the BD FACSAria™ platform |
| Plates Supported | U, V and flat-bottom 96-well plates, flat-bottom 384-well plates, Terasaki plates (BD FACSAria™ Cytometer only) |
| Laser/Filter Support | 145 (See Table 1 in Qr and Br in BD FACSDiva™ Software: Parameters for Characterizing Detector Performance) |
| Event Display | User-Defined Event Number, User-Defined Percentage |
| Standard Gating | Interval, Rectangle, Polygon, Quadrants, Hinged Quadrants |
| Logical Gating | And, Or, Not, and Rest Of |
| Auto Gating | Auto-Polygon, Auto-Interval, Snap-To Polygon, Snap-To Interval |
| Standard Statistics | Minimum, Maximum, Geometric Mean, Mean, Median, Standard Deviation, Percent Coefficient of Variation, Mode |
| Robust Statistics | Robust Standard Deviation, Robust Percent Coefficient of Variation |
| Analysis Types | Manual or Batch |
| Plot Types | Histogram, 2D Dot Plot, 2D Contour Plot, 2D Density Plot |
| Plot Alignment Tools | Left, Right, Bottom, Top, Distribute Horizontally, Distribute Vertically |
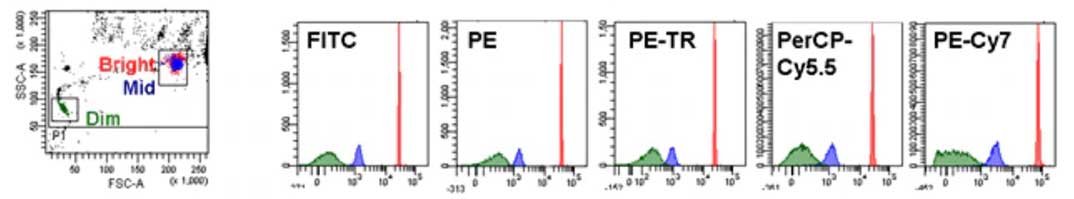
| Performance Tracking Measurements | PMTV, Qr, Br, Bright Bead Target Value, Bright Bead %rCV, Mid Bead Median, Mid Bead %rCV, Dim Bead Median, Dim Bead %rCV, Forward Scatter Laser Delay, Fluorescence Laser Delay, Laser Current, Laser Power, Fluidics Pressure |
| Scaling | Linear, Log, Biexponential |
| Automated Setup | Define Baseline, Check Performance, Auto Compensation, Reset Target Values |
| Export Formats | JPG, TIFF, PNG, BMP, XML, CSV, PDF |
| Export Files | Experiments, FCS Files, Statistics, Templates |
| Levey-Jennings Plots | Up to 30 |
| Operating System | v9.0: Microsoft™ Windows™ 10 |
BD FACSDiva™ Software supports data integrity and helps ensure reproducible results by enabling automated cytometer setup
Experiment and application setup
The software:
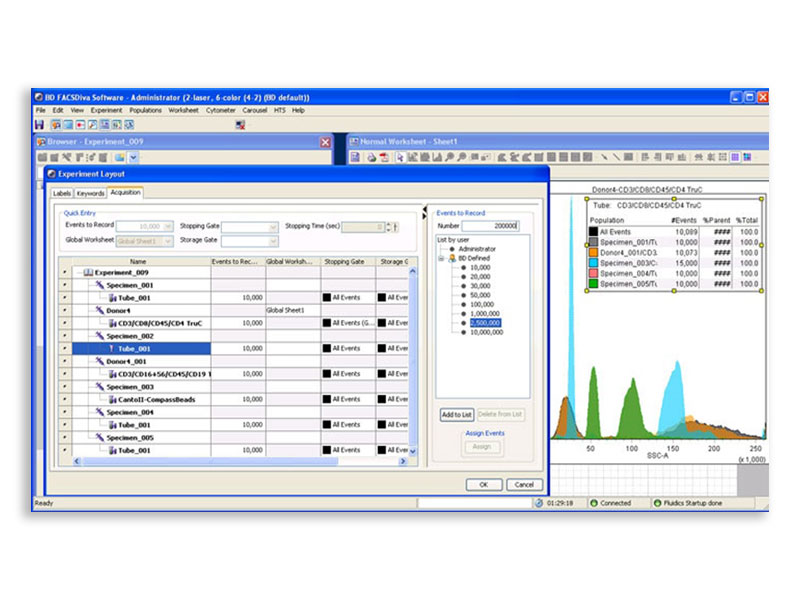
- Provides convenient and easy experiment layout tools to simplify creation of experiments
- Enables a graphical view of the entire experiment and allows quick addition of labels, keywords and acquisition attributes to a single tube, multiple tubes, specimens or the entire experiment
- Offers the ability to store experiment, analysis and panel templates for re-use without sacrificing data integrity
- Provides the ability to save specific settings to properly resolve populations of interest and to ensure that each specific application/experiment run consistently from day to day.
Automated Daily Setup and QC
A single daily setup run using BD FACSDiva™ Software and BD FACSDiva™ CS&T Beads* supports consistency and accuracy of data acquisition.
Automatic cytometer adjustments
Using the Experiment Layout feature in BD FACSDiva™ Software greatly simplifies and speeds up creating a new experiment.
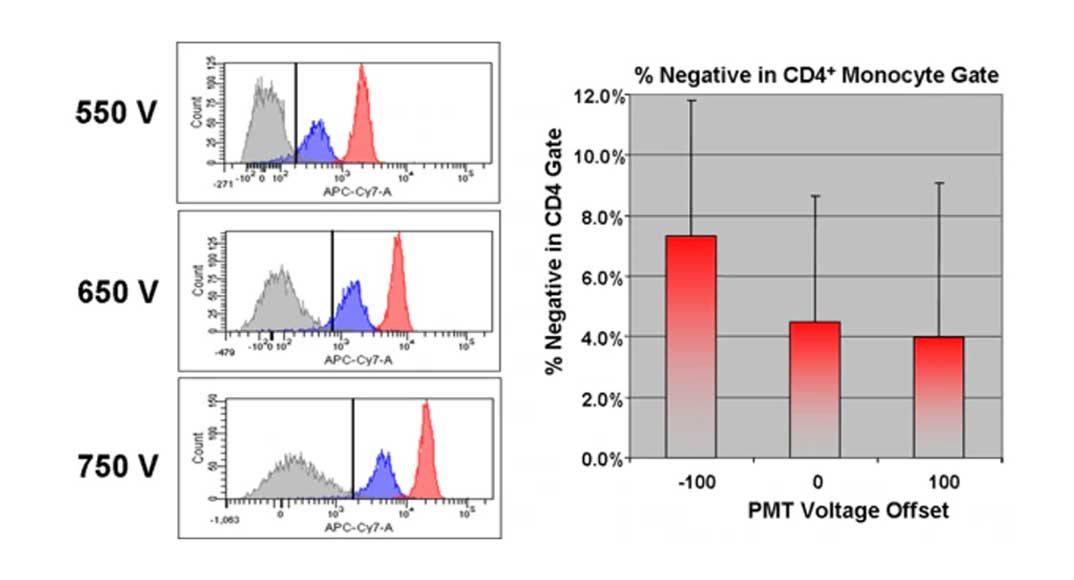
Key cytometer setup values for PMT voltages, laser delay and area scaling factors are automatically calculated and adjusted to maintain optimal performance levels over time. This automation reduces startup time to approximately five minutes and eliminates multiple error-prone and expensive data acquisitions and calculations.
Baseline and daily performance reports are automatically generated and organized for easy recall. Out of boundary results are flagged for the user to quickly identify potential problem areas.
Note: refer to the BD FACSDiva Software Reference Manual and the BD Cytometer Setup and Tracking Application Guide for more details on how to create baseline, performance checks and application settings (upgrading from FACSDiva v6.x to v8.0 causes loss of existing baseline and application settings)
Cytometer Configuration Setup
BD FACSDiva™ Software provides a graphic of the cytometer's physical optical configuration, showing the layout of detectors, filters and mirrors. This allows users to select the correct configuration for their work.
Administrators can create– for BD FACSCelesta™, BD FACSAria™ II, III and BD FACSCAria™ Fusion, for BD® LSR II, BD LSRFortessa™ and BD LSRFortessa™ X-20, specialized configurations for particular applications by dragging filters, mirrors and fluorochromes onto a representation of the optical bench. NOTE: The creation of customized configurations is not available for the FACSCanto family flow cytometers.
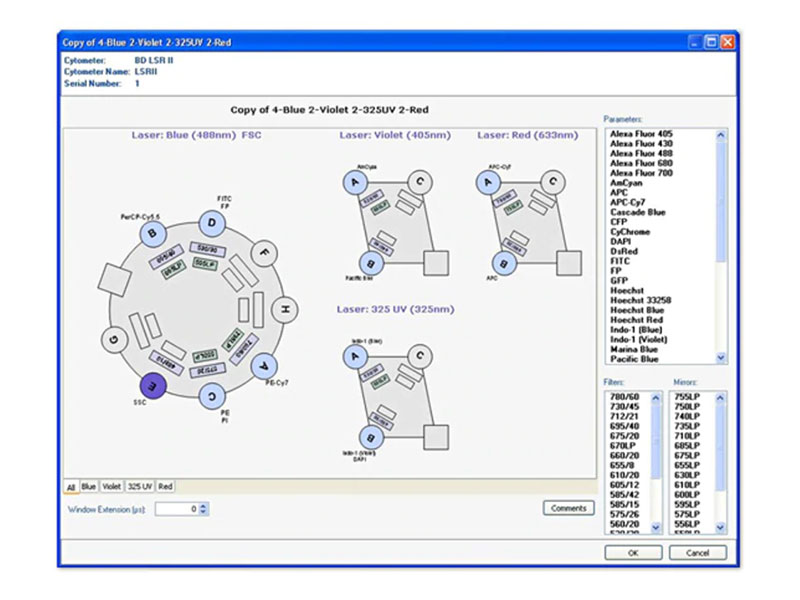
Visual tools for cytometer configuration setup
Cytometer configuration setup is quickly completed through drag and drop of parameters, filters or mirrors onto the appropriate optical bench location.
BD FACSDiva™ Software simplifies instrument quality control providing automated performance tracking
The software is designed to automatically track a wide range of performance metrics for each system detector and laser (e.g., detection efficiency, standard deviation of electronic noise, laser current, and optical background) displaying the results in interactive Levey-Jennings charts.
Alarm and notification criteria can also be set to automatically notify users if performance metrics fall outside defined boundaries, for early troubleshooting and correction.
BD FACSDiva™ Software enables efficient experiment management
Acquisition
BD FACSDiva™ Software simplifies data acquisition with a dashboard that provides the tools for immediately viewing acquisition status and for setting acquisition stopping criteria. The application settings feature automatically adjusts voltage settings to daily changes in cytometer performance so that users can run existing applications more simply and quickly.
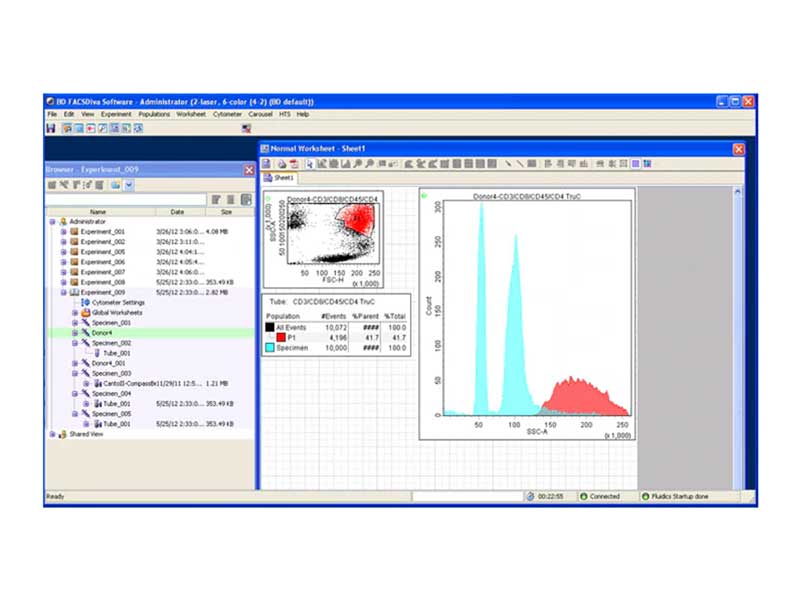
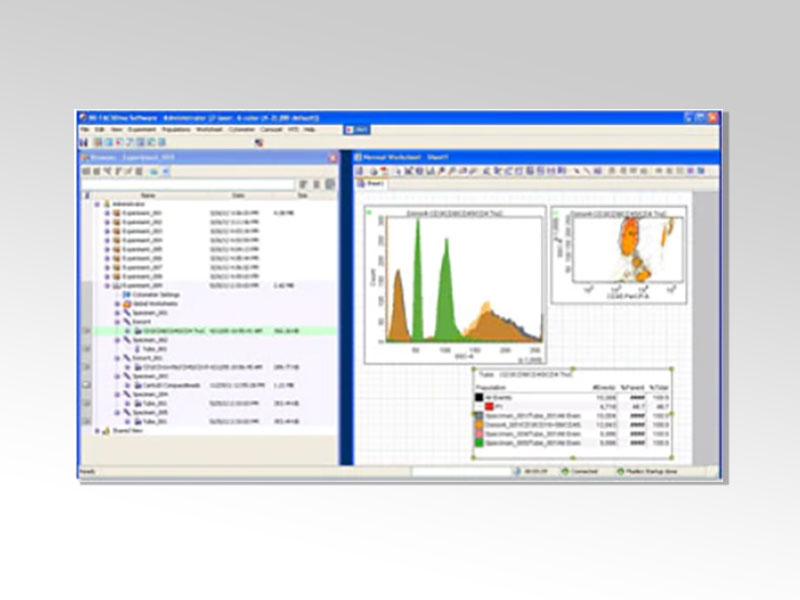
BD FACSDiva™ Software provides the ability to overlay multiple different samples and any or all populations within each tube of data.
Analysis
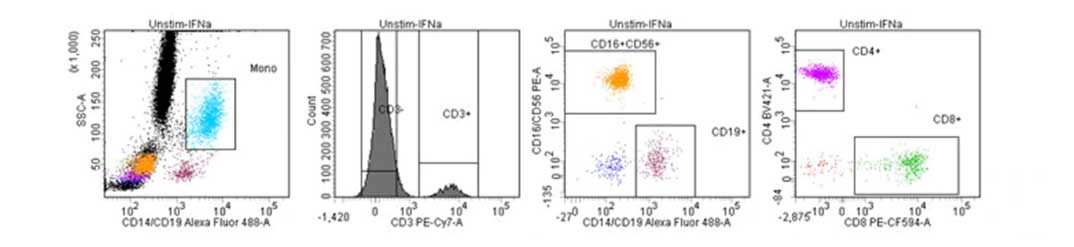
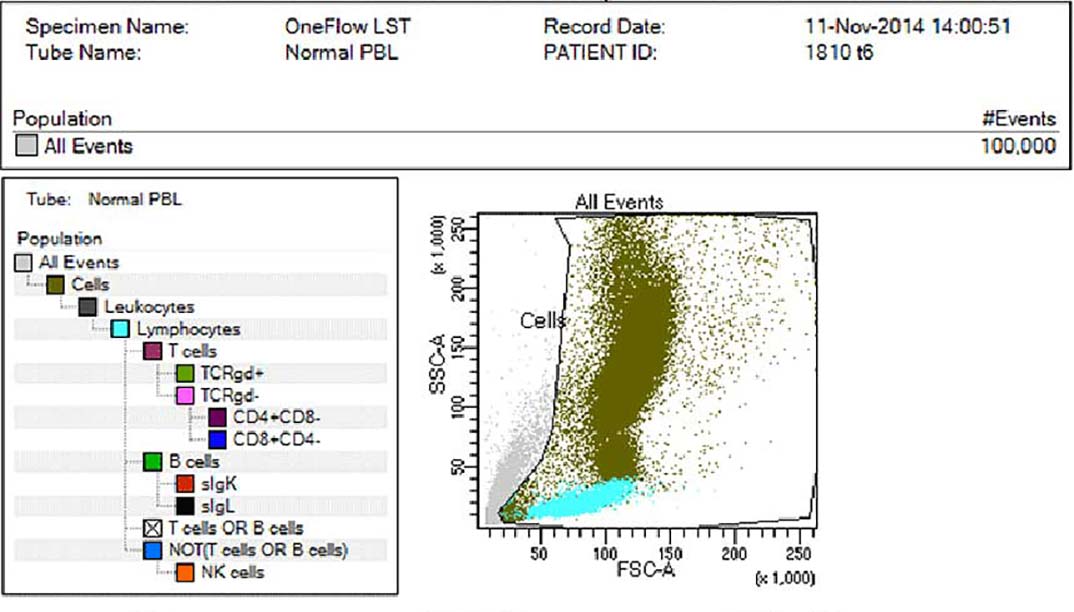
BD FACSDiva™ Software provides a wide array of basic analysis features enabling multiple applications to run on the BD FACSCanto™, BD® LSR and BD FACSAria™ Flow Cytometers. These include gating tools to automatically find a population, biexponential scaling to completely see populations that might have negative relative fluorescence intensities, and overlays to compare multiple tubes or samples.
Reporting
Worksheets are configurable using predefined and customizable headers and footers. Snap-to grids allow for easy alignments of plots, comments and statistics. Previewing and PDF creation can be done within the BD FACSDiva™ Software interface.
Data management
BD FACSDiva software offers efficient data management tools to simplify data storage as well as improve organization of flow cytometer data. It provides automated data export in XML, FCS, and even ZIP formats, for multiple files concurrently. Manual export of FCS files creates an experiment folder structure in the operating system for easy identification of data files without the need to open them.
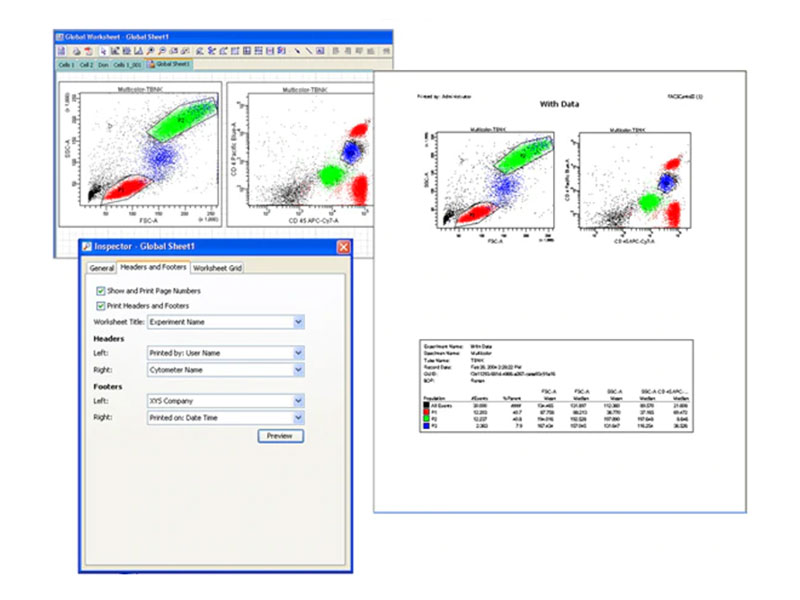
BD FACSDiva™ Software offers simple tools for data reporting that provide flexible defined layout definiton and easy previewing and printing.
APPLICATIONS
-
Application Notes

-
Product Information Sheets
-
Job Aids
-
BD FACSAria Product Family
-
BD FACSCanto Product Family
-
BD LSRFortessa Product Family
-
Webinars
![]()
BD FACSDiva™ CS&T IVD Beads, BD OneFlow™ products, BD FACSCanto™ II Flow Cytometer and its optional BD FACS™ Loader are in vitro diagnostic medical devices bearing a CE mark.
BD FACSCelesta™, BD FACSAria™ III, BD FACSAria™ Fusion, BD LSRFortessa™, BD LSRFortessa™ X-20, BD™ High Throughput Sampler, BD FACS™ Accudrop Beads, BD Phosflow™ products and BD FACSDiva™ CS&T Research Beads are for Research Use Only. Not for use in diagnostic or therapeutic procedures.
BD Flow Cytometers are Class 1 Laser Products.
BD FACSAria™ II and BD™ LSR II are discontinued.
BD FACSCanto™ Flow Cytometer (10-color configuration) is discontinued in EU.