





BD Pharmingen™ NHP T Lymphocyte Cocktail
(RUO)


Description
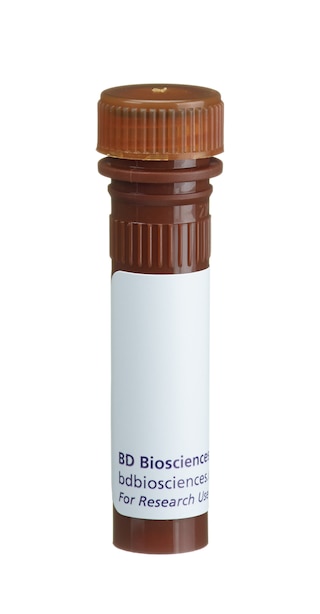
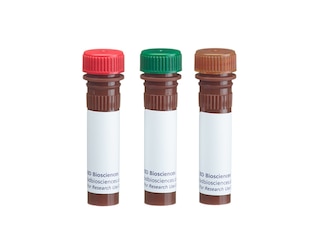
The NHP T Lymphocyte Cocktail is a three-color reagent cocktail designed to identify NHP T lymphocytes by direct immunofluorescence staining with flow cytometric analysis. The SK1 antibody reacts with the hinge-like membrane-proximal domain of the 32-kDa alpha chain of the CD8 differentiation antigen.. The CD8α and β chains (CD8a and CD8b, respectively) form a heterodimer on the surface of most thymocytes and a subpopuplation of mature T-lymphocytes (ie, MHC class I-restricted T cells, including most T suppressor/cytotoxic cells). The L200 antibody reacts with the human form of the 56 kDa transmembrane glycoprotein, CD4, present on the T-helper/inducer subset of normal human donor peripheral blood lymphocytes. L200 antibody also cross-reacts with a subset of CD3-positive peripheral blood lymphocytes, but not monocytes, of both rhesus and cynomolgus macaque monkeys. Cross-reactivity on both lymphocytes and monocytes (weak) of baboon is also observed. The distribution on lymphocytes is similar for both human and monkey, with the majority of CD4-positive lymphocytes being CD8-negative and lacking reactivity with antibodies to B- or NK-cell markers. The SP34-2 antibody reacts with the T-cell receptor-associated CD3 cell-surface antigen found on thymocytes and peripheral T lymphocytes. Clone SP34-2 is a mouse IgG1 isotype monoclonal antibody, descendant of SP34 (mouse IgG3), with the same specificity and reactivity pattern as the parent clone. It cross-reacts with a major subset of peripheral blood lymphocytes, but not monocytes or granulocytes, of baboon, and rhesus, cynomolgus, and pigtail macaque monkeys.
Preparation And Storage


Recommended Assay Procedures
BD® CompBeads can be used as surrogates to assess fluorescence spillover (compensation). When fluorochrome conjugated antibodies are bound to BD® CompBeads, they have spectral properties very similar to cells. However, for some fluorochromes there can be small differences in spectral emissions compared to cells, resulting in spillover values that differ when compared to biological controls. It is strongly recommended that when using a reagent for the first time, users compare the spillover on cell and BD® CompBeads to ensure that BD® CompBeads are appropriate for your specific cellular application.
Product Notices
- This reagent has been pre-diluted for use at the recommended Volume per Test. We typically use 1 × 10^6 cells in a 100-µl experimental sample (a test).
- This conjugated product is sold under license to the following patents: US Patent No. 5,798,276.
- Source of all serum proteins is from USDA inspected abattoirs located in the United States.
- Caution: Sodium azide yields highly toxic hydrazoic acid under acidic conditions. Dilute azide compounds in running water before discarding to avoid accumulation of potentially explosive deposits in plumbing.
- For fluorochrome spectra and suitable instrument settings, please refer to our Multicolor Flow Cytometry web page at www.bdbiosciences.com/colors.
- Please refer to www.bdbiosciences.com/us/s/resources for technical protocols.
- Please refer to http://regdocs.bd.com to access safety data sheets (SDS).
- This APC-conjugated reagent can be used in any flow cytometer equipped with a dye, HeNe, or red diode laser.
Companion Products
| Description | Quantity/Size | Part Number | EntrezGene ID |
|---|---|---|---|
| FITC Mouse anti-Human CD3 | N/A | 51-540-9004931 | N/A |
| PE anti-Human CD4 | N/A | 51-550-71735 | N/A |
| APC Mouse anti-Human CD8 | N/A | 51-590-9007502 | N/A |
Development References (4)
-
Bleavins MR, Brott DA, Alvey JD, de la Iglesia FA. Flow cytometric characterization of lymphocyte subpopulations in the cynomolgus monkey (Macaca fascicularis). Vet Immunol Immunopathol. 1993; 37(1):1-13. (Biology). View Reference
-
Jacobsen CN, Aasted B, Broe MK, Petersen JL. Reactivities of 20 anti-human monoclonal antibodies with leucocytes from ten different animal species. Vet Immunol Immunopathol. 1993; 39(4):461-466. (Biology). View Reference
-
Knapp W. W. Knapp .. et al., ed. Leucocyte typing IV : white cell differentiation antigens. Oxford New York: Oxford University Press; 1989:1-1182.
-
Schlossman SF. Stuart F. Schlossman .. et al., ed. Leucocyte typing V : white cell differentiation antigens : proceedings of the fifth international workshop and conference held in Boston, USA, 3-7 November, 1993. Oxford: Oxford University Press; 1995.
Please refer to Support Documents for Quality Certificates
Global - Refer to manufacturer's instructions for use and related User Manuals and Technical data sheets before using this products as described
Comparisons, where applicable, are made against older BD Technology, manual methods or are general performance claims. Comparisons are not made against non-BD technologies, unless otherwise noted.
For Research Use Only. Not for use in diagnostic or therapeutic procedures.
