

Return to the BD® Spectrum Viewer>
Overview
The BD® Spectrum Viewer is an interactive, online tool to support flow cytometry fluorochrome comparison and selection. The tool enables you to:
- Analyze and compare excitation (Ex) and emission (Em) spectra of a broad library of dyes
- Detect spillover and optimize fluorochrome selection for your instrument configuration/filters setup
- Toggle between Combined Ex/Em Graph view or Stacked Ex/Em Graphs view for easier visibility between spectra
- Visualize and analyze emission profiles on any standard flow cytometer or select a BD spectral flow cytometer configuration and access similarity and complexity indexes
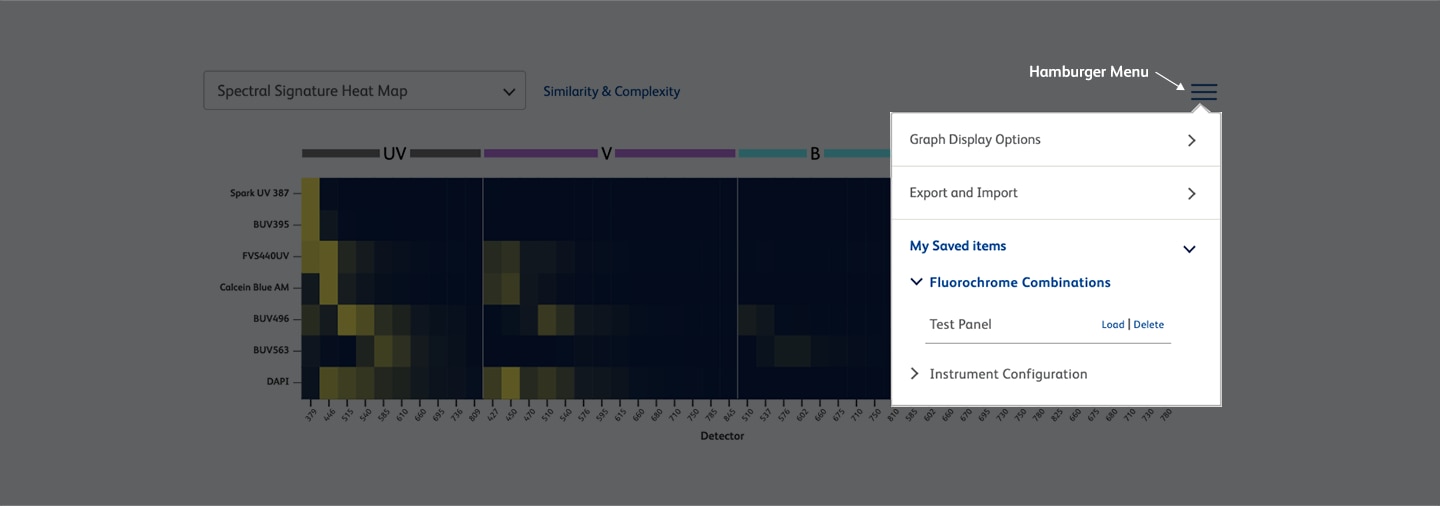
- Visualize peak intensities of spectral signatures in a unique heatmap, which is especially helpful when looking at large fluorochrome combinations
- Save, export and/or share your work
Instrument Selection
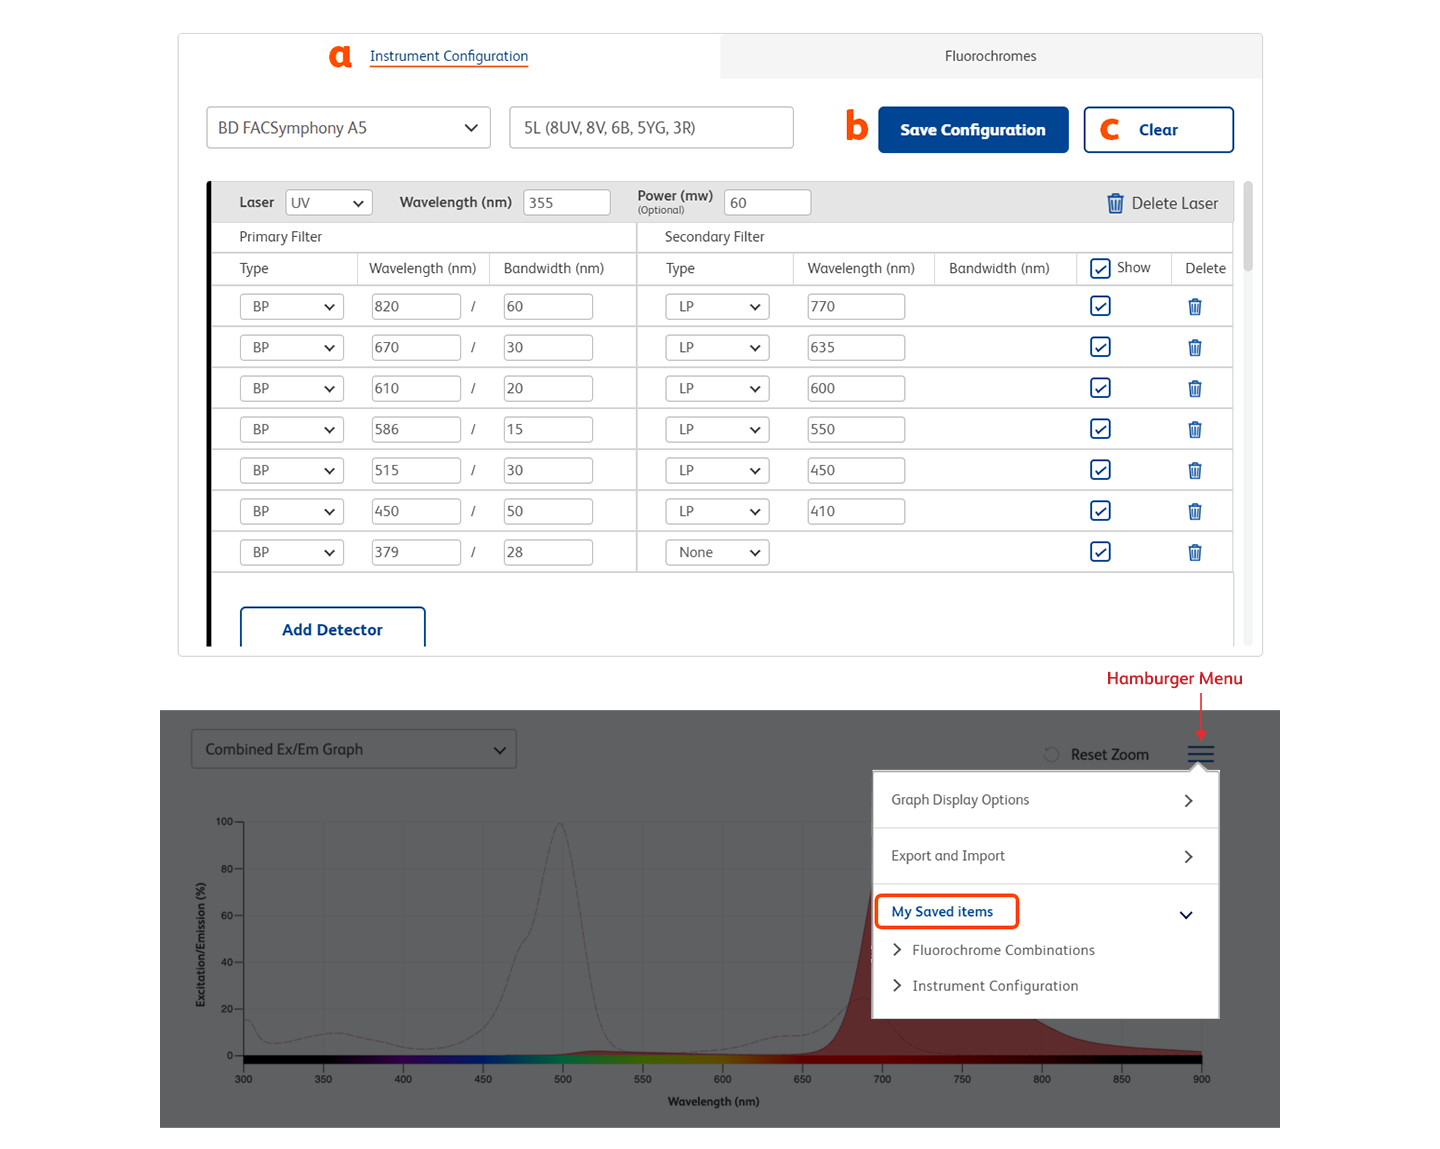
- Select from a list of preconfigured BD instruments using the drop-down list available in the Instrument Configuration tab (a) under the graph.
- Alternatively, build a unique configuration by clicking the blue Add Laser(s) & Filters(s) button.
- Save unique instrument configurations in one of two ways. If you are logged in to your BD Biosciences account, click the Save Configuration button (b) and find the file later under My Saved Items in the hamburger menu. Without an account/signing in, use the Export and Import option from the hamburger menu; refer to the Save and share instructions below for more details.
TIP: You can start with a standard configuration as a template, then adjust/add/delete detectors, lasers and filters in the table. Use the Clear button (c) to reset.
TIP: Fluorochromes can be visualized without choosing an instrument configuration or by a specific laser through the Add Laser(s) & Filters(s) button from the Instrument Configuration tab. To start adding fluorochromes, see the Fluorochrome selection section below.
Fluorochrome selection
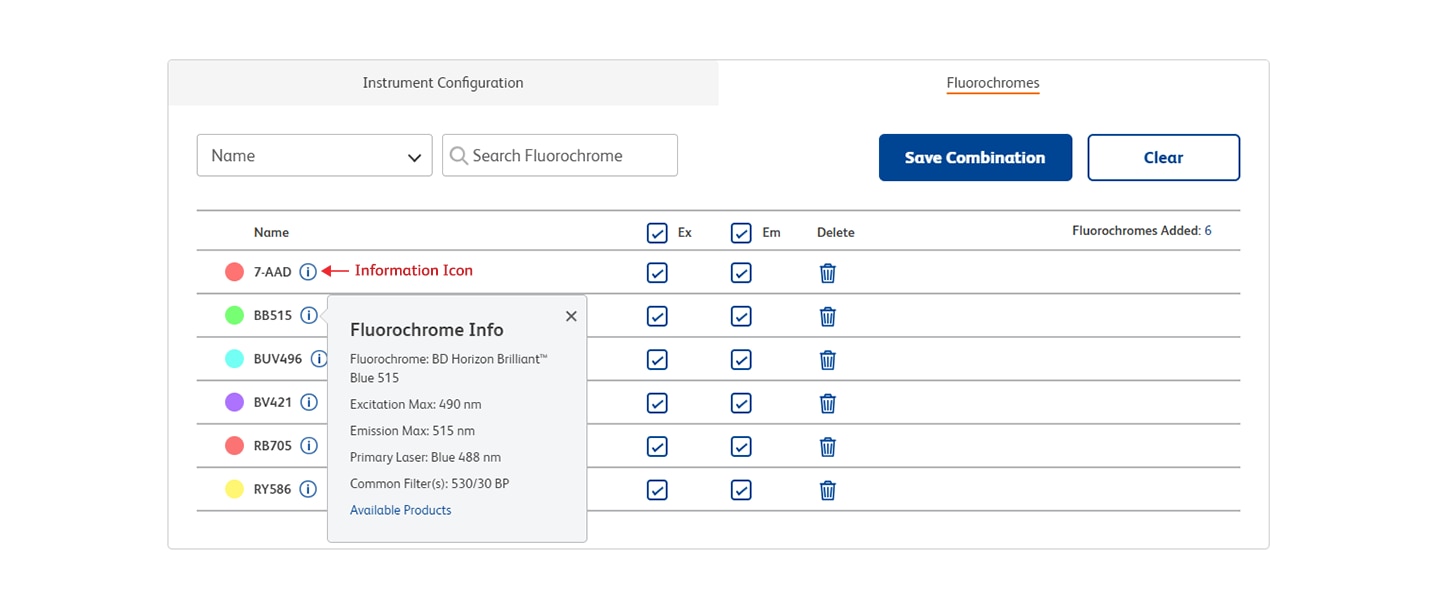
- Fluorochromes can be added by name, laser, range of excitation or range of emission. Select multiple fluorochromes from one set of search results or add additional fluorochromes by continuing to search and clicking Add.
- After a fluorochrome is selected, corresponding emission and excitation curves will be displayed. Deselect Ex or Em in the fluorochrome list to modify the view. Hover over an excitation or emission curve to highlight the individual spectrum. Alternatively, highlight one or more fluorochromes in the graph by selecting them from your list in the fluorochrome tab.
- Save fluorochrome combinations in one of two ways. If you are logged in to your BD Biosciences account, click the Save Configuration button and find the file later under My Saved Items in the hamburger menu. Without an account/signing in, use the Export and Import option from the hamburger menu; refer to the Save and share instructions below for more details.
- Check back often as new fluorochromes will be added periodically.
TIP: Click on the information icon in the fluorochrome list to view basic fluorochrome information and access our catalog.
Visualization and manipulation
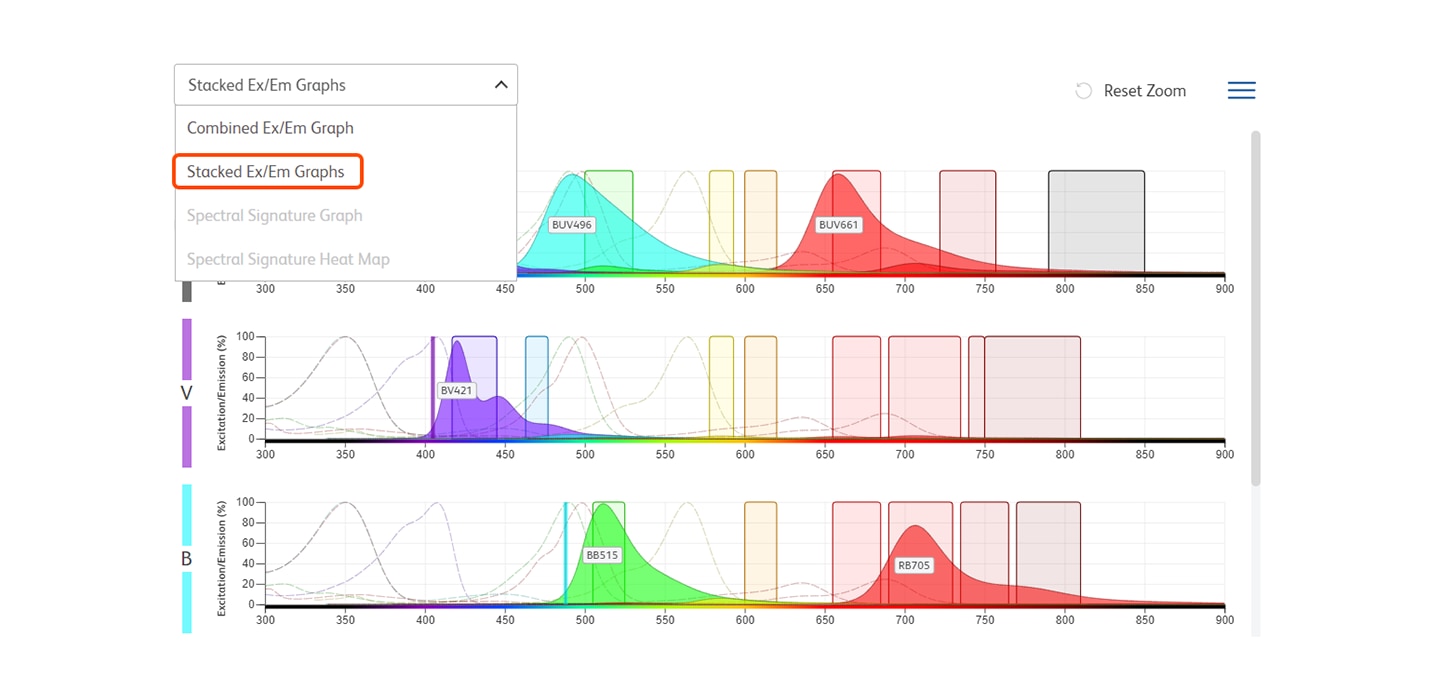
- Visualize fluorochromes in a single-laser stack by selecting Stacked Ex/Em Graphs in the drop-down menu above the graph. Default setting is normalized by laser.
- Use the scrollbar on the right to view any additional laser lines. Toggle back to Combined Ex/Em Graph using the same drop-down menu.
- To zoom in to a particular area on the graph, use your cursor (+) to click and drag over the area of interest. Click Reset Zoom above the graph to return to the default view.
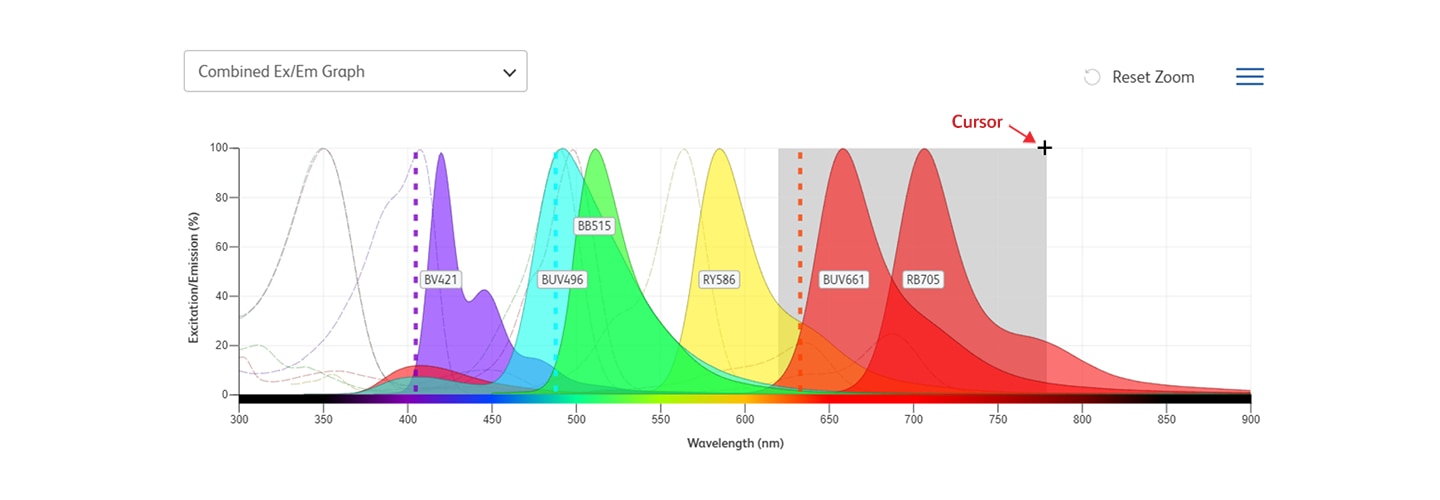
- Additional selections can be made under Graph Display Options in the hamburger menu.
- Enable Mouseover Details
- Normalize Emission to Laser Excitation
- Alternate Color Scheme
- Show Background Grid
- Show Fluorochrome Labels (hiding labels allows labels to be shown on hover)
- Resolve Filter Overlap
- Hover your cursor over an emission profile to see fluorochrome label information.
- Highlight one or more fluorochromes in the graph by selecting them from your list in the fluorochrome tab.
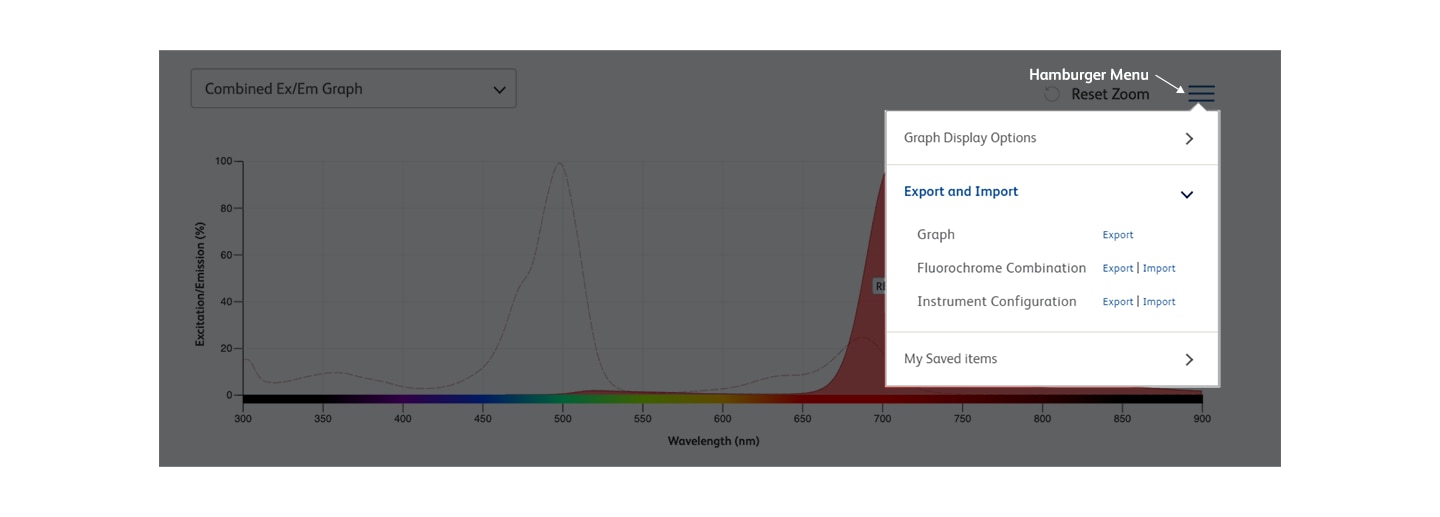
TIP: You can export an image of the graph(s) by clicking on the hamburger menu, expanding the Export and Import section and clicking Export next to Graph. To learn more about our export and import features, see the Save and share section below.
Save and Share
- Save and share spectral graph images, fluorochrome combinations and customized instrument configurations.
- Without logging in, you can export and import fluorochrome lists and customized instrument configurations as .csv files. These can be saved or shared locally and imported later using the Import option. Spectral graph images can be downloaded as a variety of file types that can be saved locally.
- If you are logged in to your BD Biosciences account, you can save fluorochrome lists and instrument configurations as user-specific files within your account. These can be loaded from the My Saved Items section of the hamburger menu.
- Without logging in, you can export and import fluorochrome lists and customized instrument configurations as .csv files. These can be saved or shared locally and imported later using the Import option. Spectral graph images can be downloaded as a variety of file types that can be saved locally.
Instrument Selection
- Spectral features are only available when selecting a spectral flow cytometer and are not available when a standard flow cytometer or custom configuration is chosen.
- For spectral flow cytometry experiments using the BD FACSymphony™ A5 SE, BD FACSymphony™ S6 SE or BD FACSDiscover™ S8 Flow Cytometers, select this instrument from the instrument drop-down list. Spectral instruments are not configurable, so customization is not possible, and lasers, filters and other options are greyed out. There is no option to save this configuration.
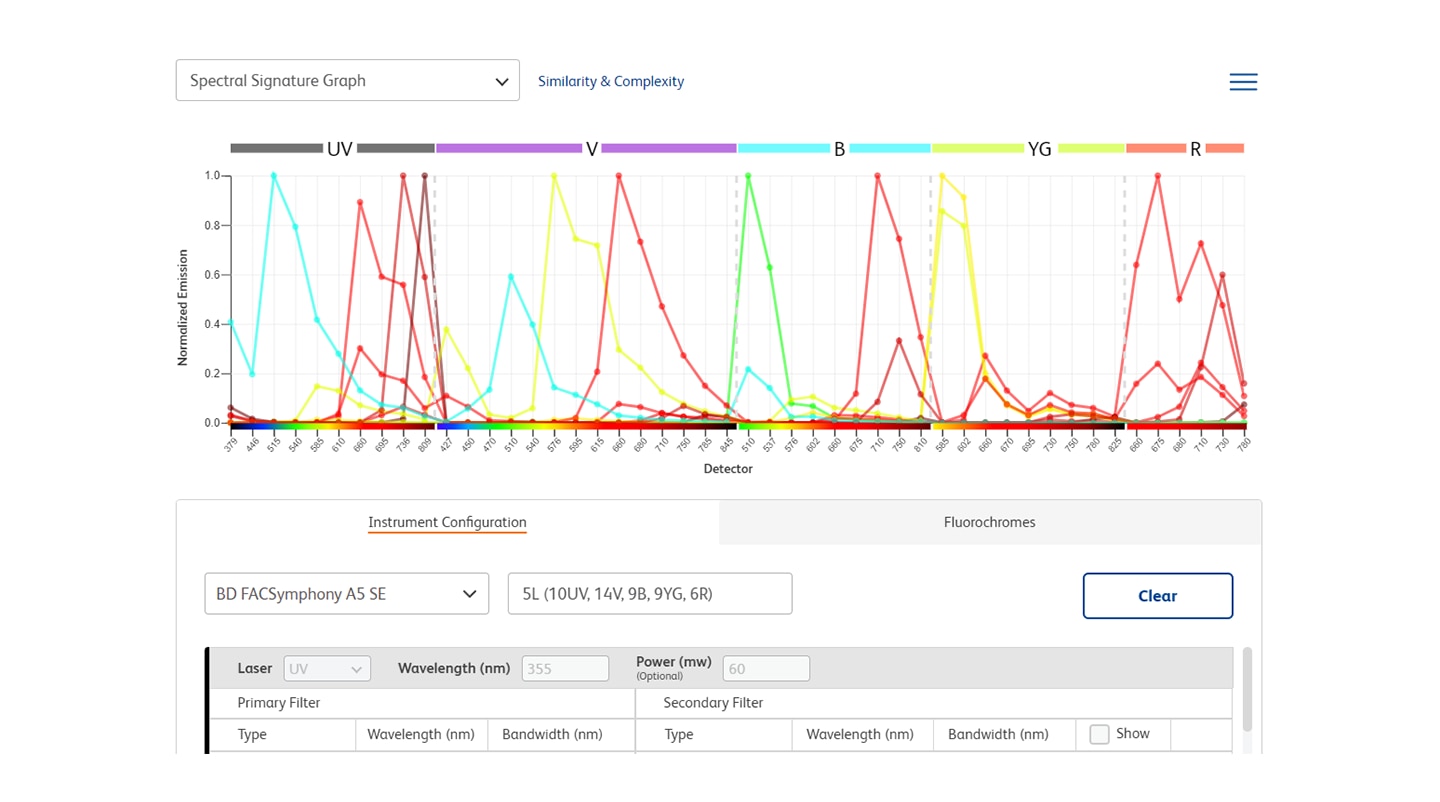
- The default view becomes the Spectral Signature Graph.
TIP: Fluorochromes can be visualized without choosing an instrument configuration or by a specific laser through the Add Laser(s) & Filters(s) button from the Instrument Configuration tab. To start adding fluorochromes, see the Fluorochrome selection section below.
Fluorochrome selection
- Fluorochromes can be added by name, laser, range of excitation or range of emission. Select multiple fluorochromes from one set of search results or add additional fluorochromes by continuing to search and clicking Add.
- After a fluorochrome is selected, corresponding emission and excitation curves will be displayed. Deselect Ex or Em in the fluorochrome list to modify the view. Hover over an excitation or emission curve to highlight the individual spectrum. Alternatively, highlight one or more fluorochromes in the graph by selecting them from your list in the fluorochrome tab.
- Save fluorochrome combinations in one of two ways. If you are logged in to your BD Biosciences account, click the Save Configuration button and find the file later under My Saved Items in the hamburger menu. Without an account/signing in, use the Export and Import option from the hamburger menu; refer to the Save and share instructions below for more details.
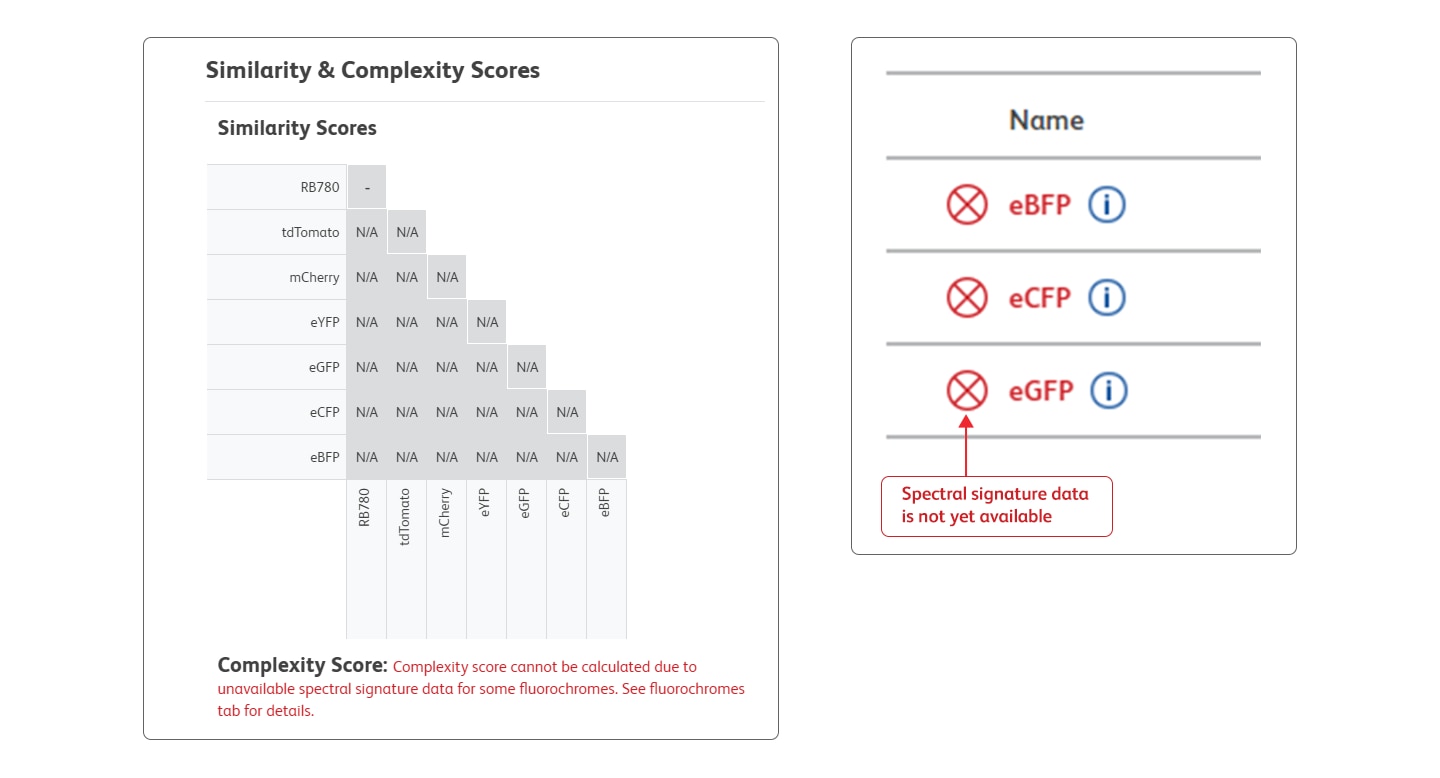
- Check back often as new fluorochromes will be added periodically. A red X beside a chosen fluorochrome denotes that spectral signature data is not yet available and it can only be displayed in the combined or stacked graph views. Likewise, similarity and complexity values will not be available.
Tip: Click on the information icon in the fluorochrome list to view basic fluorochrome information and access our catalog.
Visualization and Manipulation
The default view for spectral instrument configurations is the Spectral Signature Graph.
- Toggle to other views using the drop-down menu above the graph. You can choose between four available options: Combined Ex/Em Graph, Stacked Ex/Em Graphs, Spectral Signature Graph, and Spectral Signature Heat Map.
- Visualize fluorochromes in a single-laser stack by selecting Stacked Ex/Em Graphs in the drop-down menu above the graph. Default setting is normalized by laser. Use the scrollbar on the right to view any additional laser lines. You can also view a multi-laser view by selecting Combined Ex/Em Graph.
- The Spectral Signature Heatmap is an alternative way of visualizing the same information contained in the Spectral Signature Graph. The heatmap allows users to visualize and identify spectral signatures for all selected fluorochromes simultaneously and to assess areas of spectral overlap across the entire set. The heatmap is most useful for larger combinations of fluorochromes.
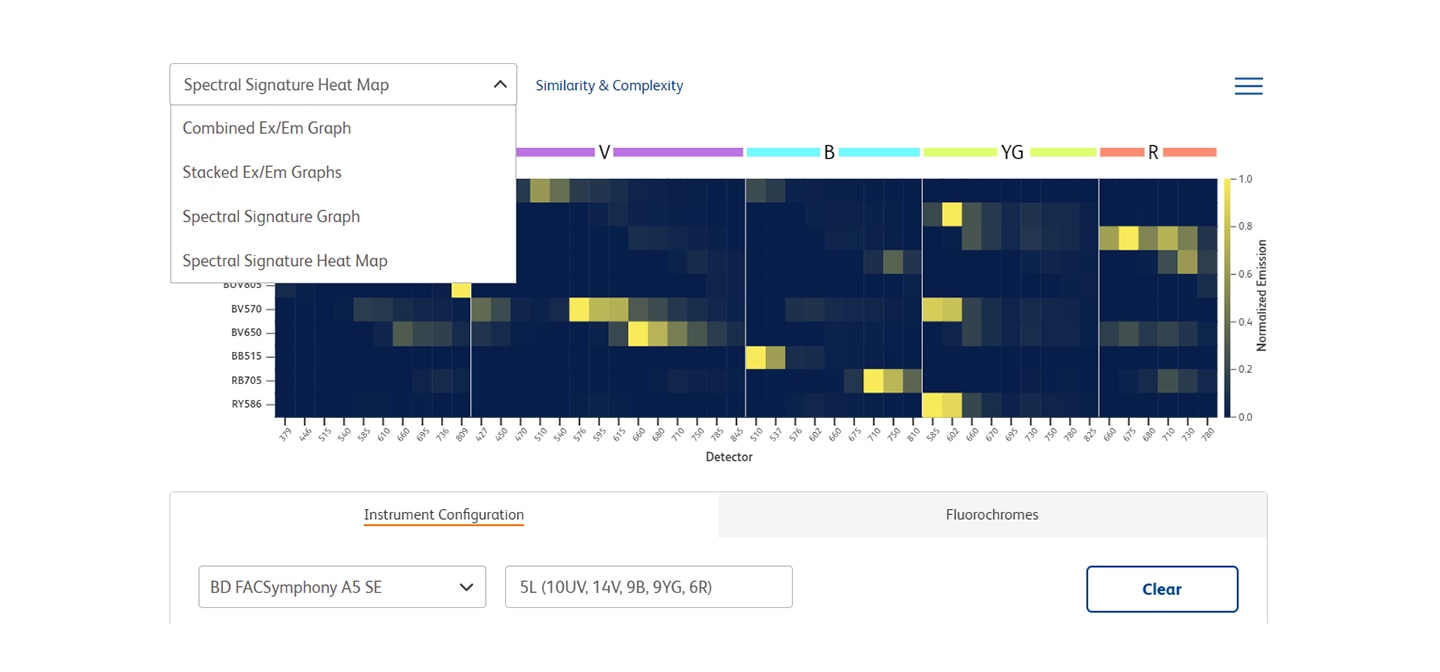
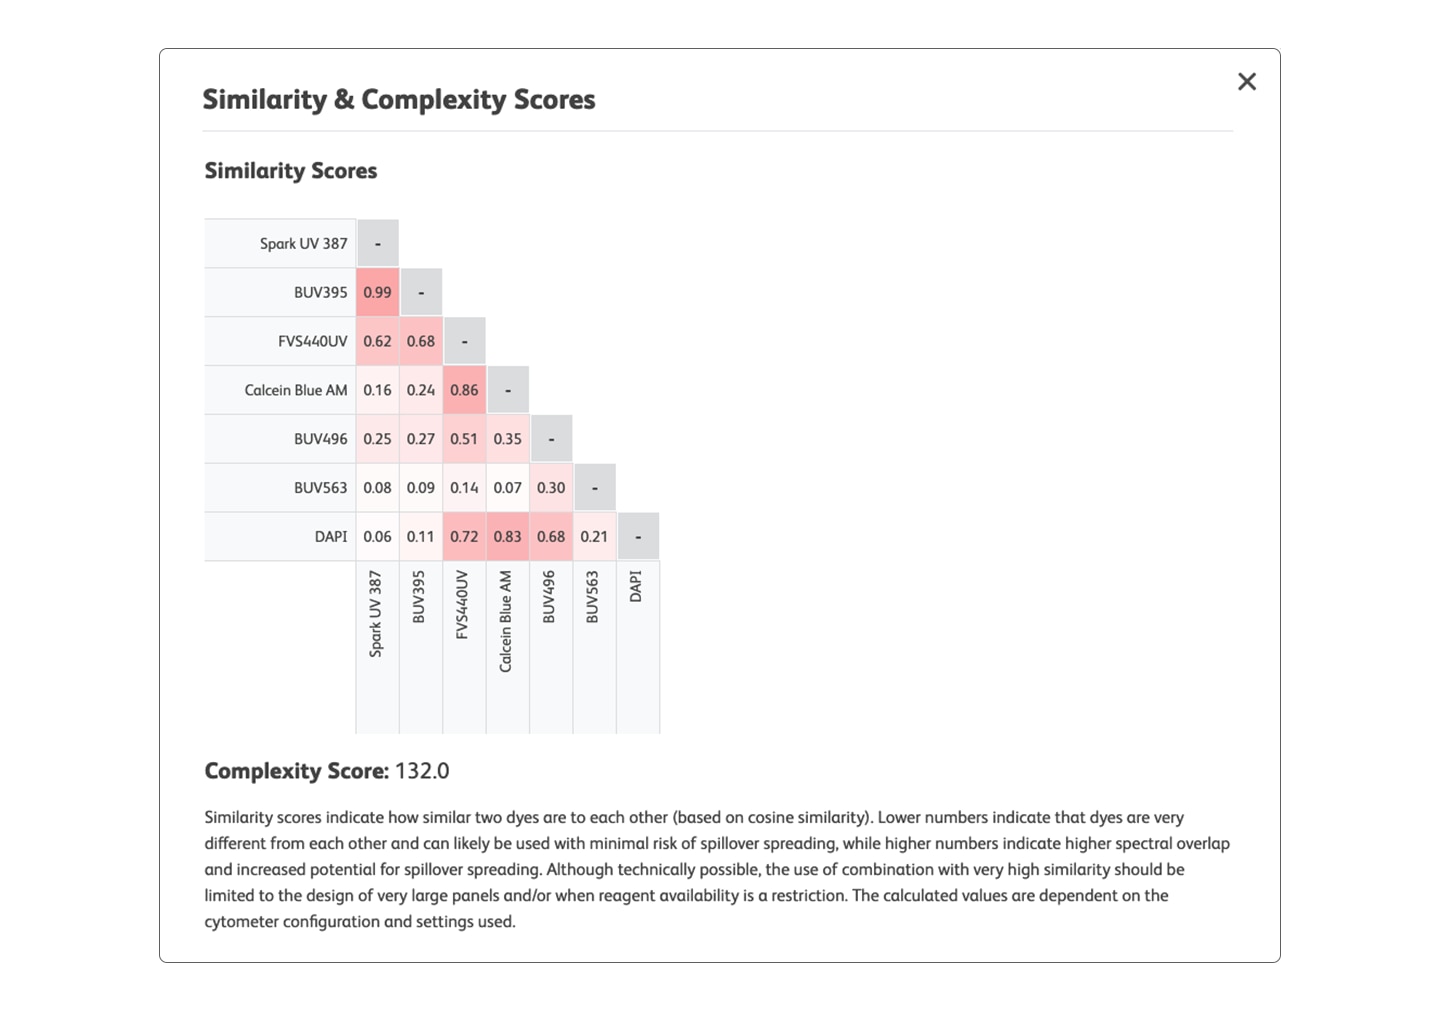
- When a spectral instrument configuration is selected, the Similarity & Complexity matrix option becomes available to the right of the drop-down menu located above the graph. Click to view the matrix in a pop-up window.
Tip: You can export the matrix for future reference in the available file formats by using the Export button at the bottom right of the pop-up window.
- Additional selections can be made under Graph Display Options in the hamburger menu.
- Enable Mouseover Details
- Alternate Color Scheme
- Show Background Grid
- Highlight one or more fluorochromes in the graph by selecting them from your list in the fluorochrome tab.
TIP: You can export an image of the graph(s) by clicking on the hamburger menu, expanding the Export and Import section and clicking Export next to Graph. To learn more about our export and import features, see the Save and share section below.
Save and Share
- Save and share spectral graph images and fluorochrome combinations.
- Without logging in, you can export and import fluorochrome lists as .csv files. These can be saved or shared locally and imported later using the Import option. Spectral graph images can be downloaded as a variety of file types that can be saved locally.
- If you are logged in to your BD Biosciences account, you can save fluorochrome lists as user-specific files within your account. These can be loaded from the My Saved Items section of the hamburger menu.
- Additionally, you can export the Similarity or Complexity matrix for future reference in the available file formats by using the Export button at the bottom right of the pop-up window.