The BD FACSDiscover™ A8 Cell Analyzer seamlessly integrates cutting-edge spectral flow cytometry with real-time imaging. By combining innovations such as BD SpectralFX™ Technology and BD CellView™ Image Technology into a single instrument, it offers unparalleled experimental power and simplified workflows to deliver reproducible results and single-cell insights that were previously undetectable. This versatile, robust and reliable instrument comes in a 5-laser configuration (B-R-V-YG-UV) with up to 78 fluorescence detectors and 8 scatter and imaging detectors.
Benefits include:
- Optimized sensitivity and resolution
- Flexibility to use imaging or high-speed mode
- Integrated autoloader with temperature control and sample mixing
- Simplified workflow to reduce setup complexity
Learn more about the BD FACSDiscover™ A8 Cell Analyzer >
Features
Take Advantage of the Advanced Spectral Resolution and Image Parameter Analysis Capabilities of the BD FACSDiscover™ A8 Cell Analyzer.
- BD SpectralFX™ Technology: Delivers exceptional sensitivity and resolution. Optimal hardware design, system-aware unmixing, and next-gen setup and QC based on LED calibrated gain interface provide highly accurate data consistently and easily at default gain settings.
- BD CellView™ Image Technology: This real-time imaging technology adds a new spatial dimension to flow cytometry analysis with image parameters like Diffusivity, Max Intensity, Radial Moment and 12 other automatically generated parameters along with scatter and fluorescent images.
- Fully Integrated Autoloader: Fully integrated inside the instrument the autoloader eliminates connectivity steps and issues for sample acquisition from plates and tube racks. High throughput and reliable, it delivers the high sample utilization and low sample carryover rate, makes it easy to maintain sample integrity with temperature control and automated sample mixing and delivers walkaway automation with automated clog/bubble detection and recovery.
- BD FACSChorus™ Software: Provides an intuitive interface for step-by-step guided navigation and makes it easy to optimize, acquire and analyze data from spectral panels with visual and unique tools such as BD® Spectral Hotspot Matrix that are built into the acquisition software.
- Fluidics: Dual-mode fluidics gives you the flexibility to get sample acquisition rates at 35,000 events/sec in high-speed mode and 12,500 events/sec in imaging mode. The instrument runs on the deionized water, eliminating the need for traditional sheath fluids for sample acquisition while volumetric acquisition and transparent merged event rate to enhance sample acquisition flexibility and accuracy.
Loader Data
The new Integrated Autoloader with temperature control and sample mixing streamlines workflows delivering the consistency you need.
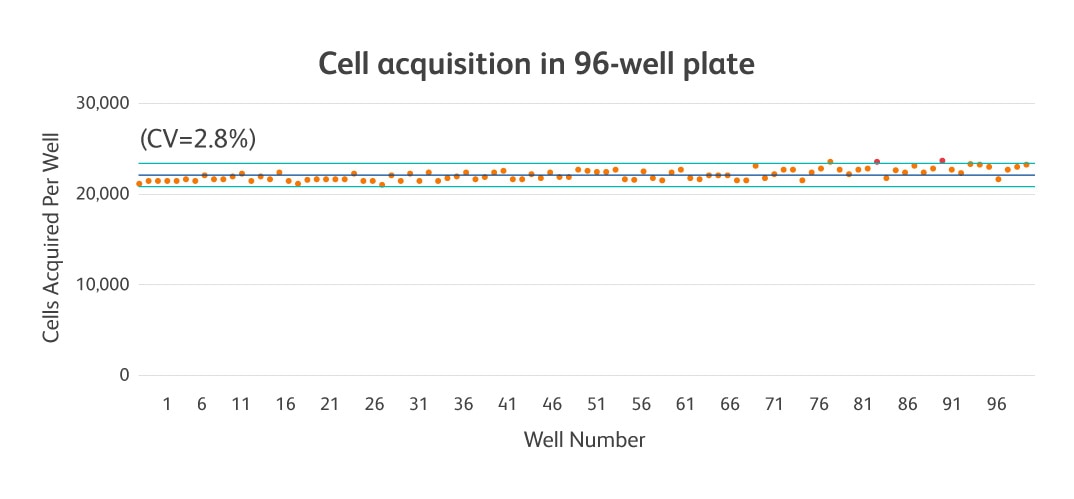
25 µl of Jurkat cells (1 million cells/ml) were analyzed from each well of a standard 96-well plate to determine cell suspension consistency throughout sample mixing and analysis. Plate agitation occurred every 4 wells. High consistency between plates was observed in the number of cells acquired per well.
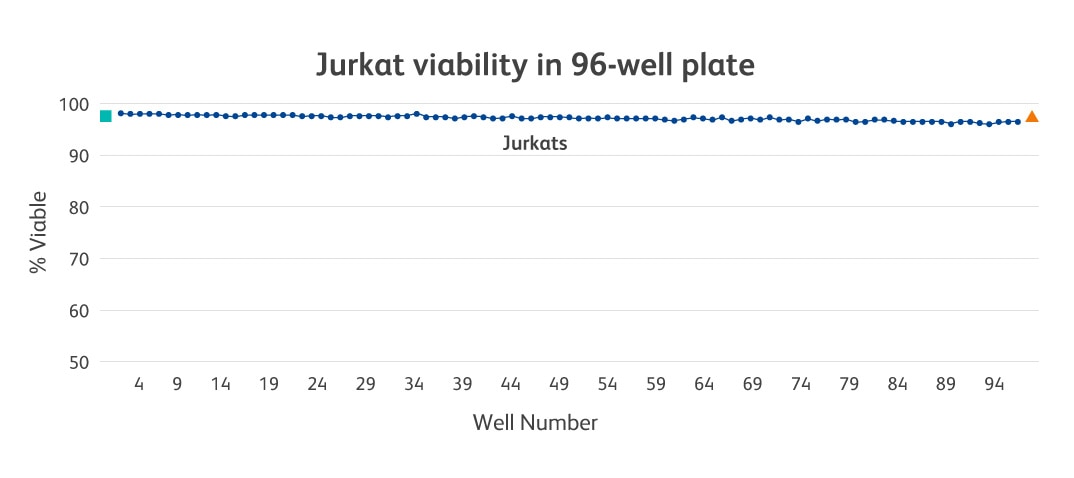
25 µl of Jurkat cells (1 million cells/ml) were analyzed from each well of a standard 96-well plate to determine impact of agitation on cell viability (7-AAD staining). Plate agitation occurred every 4 wells. No agitation controls were run before (green square) and after (red triangle) plate to determine baseline. A high percentage (close to a 100%) of viable cells were observed across the wells.
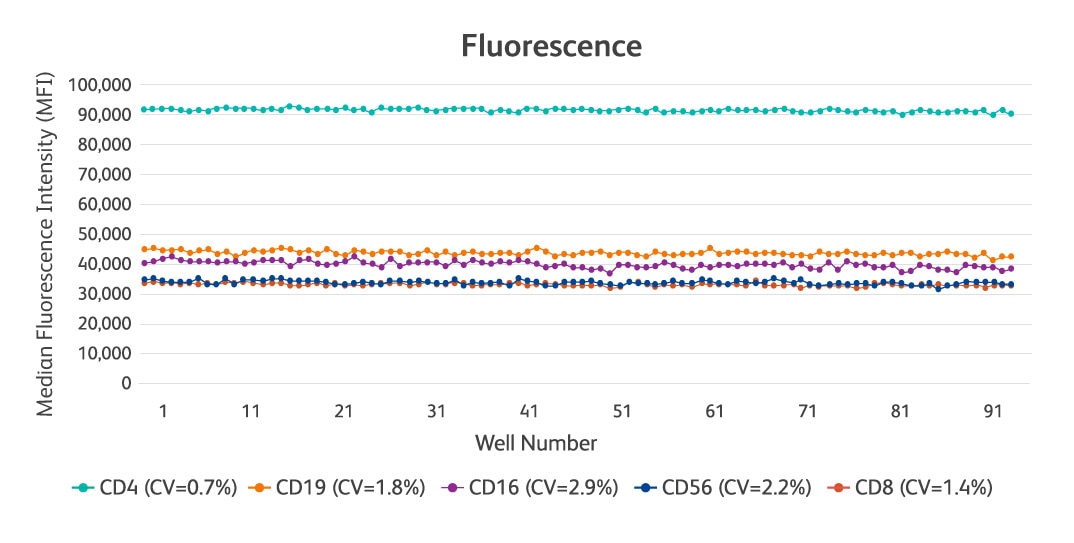
25 µl of PBMCs (1 million cells/ml) were analyzed from each well of a 96-well plate to determine impact of agitation on signal intensity. Plate agitation occurred every 4 wells. Consistent signal intensities were observed across the wells.
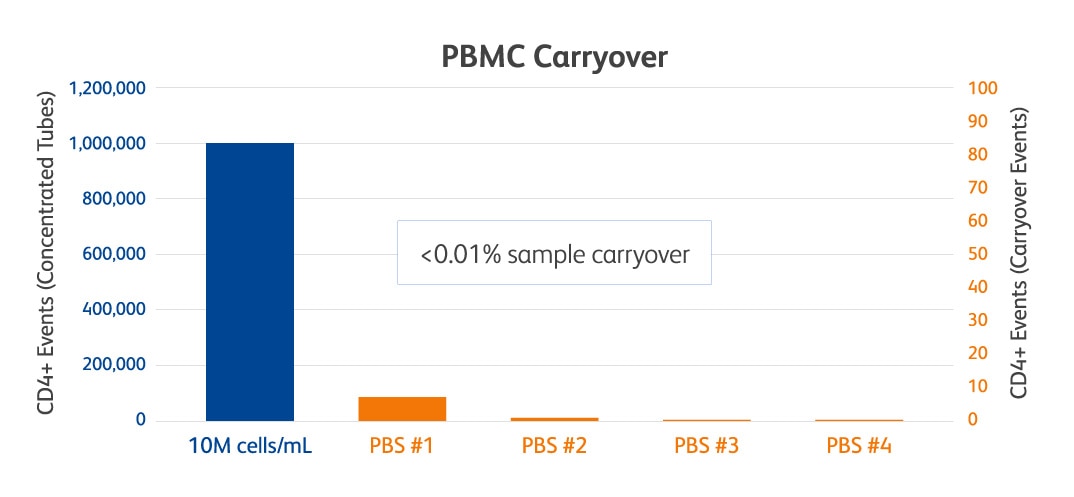
100 µL of concentrated PBMCs cells (10 million cells/mL) were acquired from one well and 1 SIT clean was done before proceeding to the next well (automated without any manual intervention). 100 µL was acquired from the subsequent wells with PBS to measure carryover. <0/01% of sample carryover was observed.
Imaging Data
Imaging parameters can be combined with standard flow cytometry parameters to measure differences in cell populations, build gating schemes, measure time courses and uncover new cell populations, enabling deeper immunophenotyping of cells.

Measuring Cell Population Differences

Building a Gating Scheme

Measuring Time Course and Concentration Gradients

Uncovering New Cell Populations
Interview with Gert Van Isterdael, Head of VIB Flow Core (Ghent)
BD Biosciences sat down with Gert Van Isterdael to ask what pushed him to acquire the BD FACSDiscover™ A8 Cell Analyzer how it is empowering VIB scientists to unlock new insights.
-
Brochure

-
Technical Specifications
-
Filter Guide
-
Flyers
BD FACSDiscover™ A8 Cell Analyzer
Please contact a representative to learn more
*Required fields
For Research Use Only. Not for use in diagnostic or therapeutic procedures.
BD Flow Cytometers are Class I Laser Products.
BD, the BD Logo and BD CellView, BD FACSDiscover and BD SpectralFX are trademarks of Becton, Dickinson and Company or its affiliates.