-
Reagents
- Flow Cytometry Reagents
-
Western Blotting and Molecular Reagents
- Immunoassay Reagents
-
Single-Cell Multiomics Reagents
- BD® OMICS-Guard Sample Preservation Buffer
- BD® AbSeq Assay
- BD® Single-Cell Multiplexing Kit
- BD Rhapsody™ ATAC-Seq Assays
- BD Rhapsody™ Whole Transcriptome Analysis (WTA) Amplification Kit
- BD Rhapsody™ TCR/BCR Next Multiomic Assays
- BD Rhapsody™ Targeted mRNA Kits
- BD Rhapsody™ Accessory Kits
- BD® OMICS-One Protein Panels
- BD OMICS-One™ WTA Next Assay
-
Functional Assays
-
Microscopy and Imaging Reagents
-
Cell Preparation and Separation Reagents
Old Browser
This page has been recently translated and is available in French now.
Looks like you're visiting us from {countryName}.
Would you like to stay on the current location site or be switched to your location?
An Optimized 50-Color Flow Cytometry Panel for Analysis of T Cells and Dendritic Cells
Immune cell analysis at the periphery and at the tissue level has provided valuable insights into our understanding of how immune cells differentiate and what roles they play, as well as how they function in various diseases. To glean a complete picture and to better understand their functions, a thorough analysis of these and other associated immune cell populations of different lineages and their activation status is critical. However, due to inherent tradeoffs in the choice of fluorochrome-marker pairings, such as spillover spreading and fluorochrome brightness, even a carefully designed flow cytometry panel may yield limited biological information at very large panel sizes.
In a recent publication in Cytometry A, Konecny et al. 20241 addressed these issues with the development of a comprehensive 50-color flow cytometry panel that provides the ability to analyze a plethora of proteins simultaneously with a limited number of cells. In addition to designing the 50-color panel while following established best practices of panel development, the authors also developed a new algorithm to determine optimal combinations and outputs of different combinations of these 50 fluorochromes.
Konecny et al. formulated a new evaluation metric to address the increased noise levels rendered by unmixing-dependent spreading error. They used this metric along with fluorochrome brightness to select combinations of fluorochromes that could increase the number of colors in the panel while preserving resolution. Spillover-spreading matrix and total spread matrix were used for the proper assignment of fluorochromes.
They developed the panel on a Sony ID7000 spectral cytometer (7-laser with 186 detectors) and the BD FACSDiscover™ S8 Cell Sorter (5-laser with 78 detectors). They were also able to sort the cells using the BD FACSDiscover™ S8 Cell Sorter allowing for isolation and further analysis of select cell populations. Further analysis of data gathered from this high-dimensional panel showed the ability to dive deep into granular details using this panel.
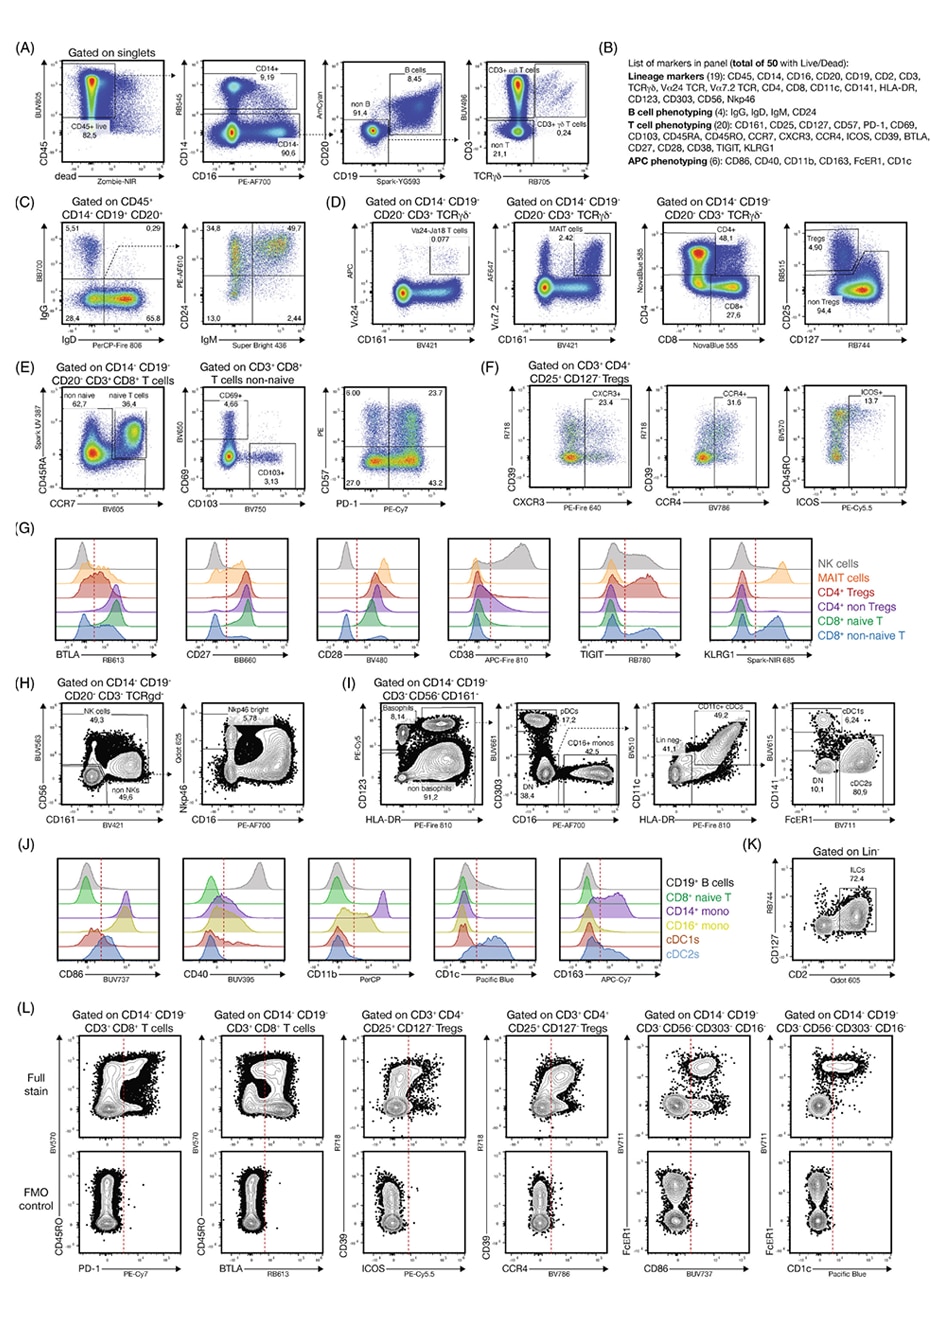
The authors used the panel to assess the differentiation and activation status of human T cells and antigen presenting cells, along with B cells, NK cells and innate lymphoid cells (ILCs).

Overview gating of the 50-color panel on cryopreserved PBMCs. PBMCs were obtained from commercial vendors, stained and acquired on a BD FACSDiscover™ S8 Cell Sorter. For further information and the list of dyes used, refer to Konecny et al. 2024.
This 50-color OMIP panel can be a very useful tool for scientists in high-dimensional analysis of immune cell populations of interest.
Read the Cytometry Part A paper entitled “OMIP-102: 50-color phenotyping of the human immune system with in-depth assessment of T cells and dendritic cells”.
References
- Konecny AJ, Mage PL, Tyznik AJ, Prlic M and Mair F. OMIP-102: 50-color phenotyping of the human immune system with in-depth assessment of T cells and dendritic cells. Cytometry Part A 2024; 105:430-436. DOI: 10.1002/cyto.a.24841
For Research Use Only. Not for use in diagnostic or therapeutic procedures.