-
Reagents
- Flow Cytometry Reagents
-
Western Blotting and Molecular Reagents
- Immunoassay Reagents
-
Single-Cell Multiomics Reagents
- BD® OMICS-Guard Sample Preservation Buffer
- BD® AbSeq Assay
- BD® Single-Cell Multiplexing Kit
- BD Rhapsody™ ATAC-Seq Assays
- BD Rhapsody™ Whole Transcriptome Analysis (WTA) Amplification Kit
- BD Rhapsody™ TCR/BCR Next Multiomic Assays
- BD Rhapsody™ Targeted mRNA Kits
- BD Rhapsody™ Accessory Kits
- BD® OMICS-One Protein Panels
- BD OMICS-One™ WTA Next Assay
-
Functional Assays
-
Microscopy and Imaging Reagents
-
Cell Preparation and Separation Reagents
Old Browser
This page has been recently translated and is available in French now.
Looks like you're visiting us from {countryName}.
Would you like to stay on the current location site or be switched to your location?
Overview
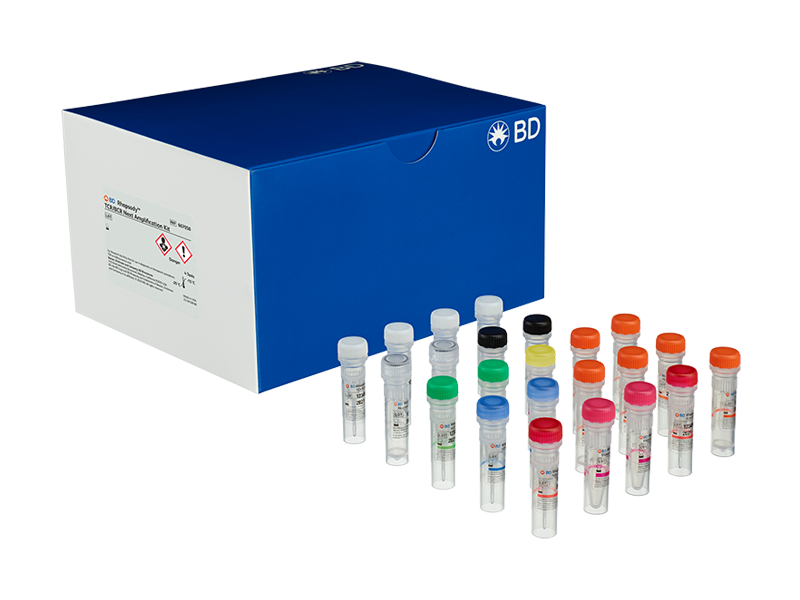
Understanding the intricacies of the immune system is crucial to elucidating roles of immune cells in health and disease. This requires profiling T- and B-cell receptors (TCRs and BCRs), key determinants of adaptive immunity. The next generation of BD Rhapsody™ TCR/BCR Multiomic Assays reveal immune repertoire richness with great sensitivity alongside simultaneous single-cell gene and protein expression analyses.

Features
Validated on our new Enhanced Cell Capture Beads V3, BD Rhapsody™ TCR/BCR Next Multiomic Assays enable a highly sensitive analysis of full-length TCR/BCR repertoires with robust workflows for human and mouse. Key features include:
- Superior full-length TCR and BCR pairing metrics
- Multiomics-enabled for simultaneous immune profiling alongside protein and gene expression analyses in the same cell
- Compatibility with preserved cells and BD® OMICS-Guard Sample Preservation Buffer
- Intuitive data analysis pipeline that provides unbiased insights about the biology of your samples
Learn more from the BD Rhapsody™ TCR/BCR Next Multiomic Assay Brochure.
Applications
A single workflow to identify and analyze T and B cell clonotypes with high sensitivity alongside single-cell whole transcriptome or targeted mRNA expression and protein analyses.
In this study, we simultaneously analyzed TCR, BCR, whole transcriptome gene expression as well as cell surface proteins using the BD® AbSeq Immune Discovery Panel in primary PBMCs. In total, 2,380 complete phenotypes were detected from 6,798 putative cells (out of 7,292 input cells).
Step 1:
Using both protein and gene expression, a UMAP plot was generated, and protein markers were used to identify cell populations.

Step 2:
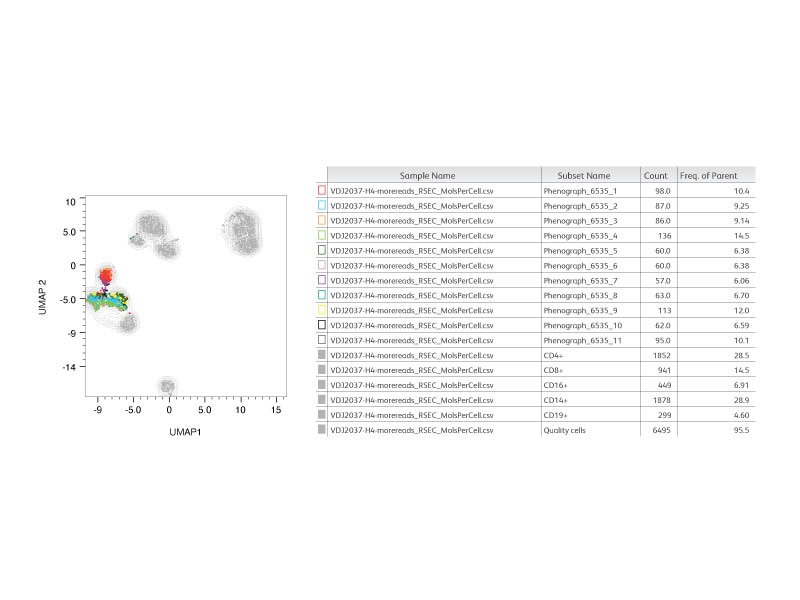
An unsupervised analysis (phenograph) was performed on CD8+ cells where 11 clusters were identified.

Step 3:
Frequencies of unique clonotypes within CD8+ were reported.

Step 4:
The top 5 clonotypes were overlaid on the UMAP plot and identified within phenograph clusters.

Step 5:
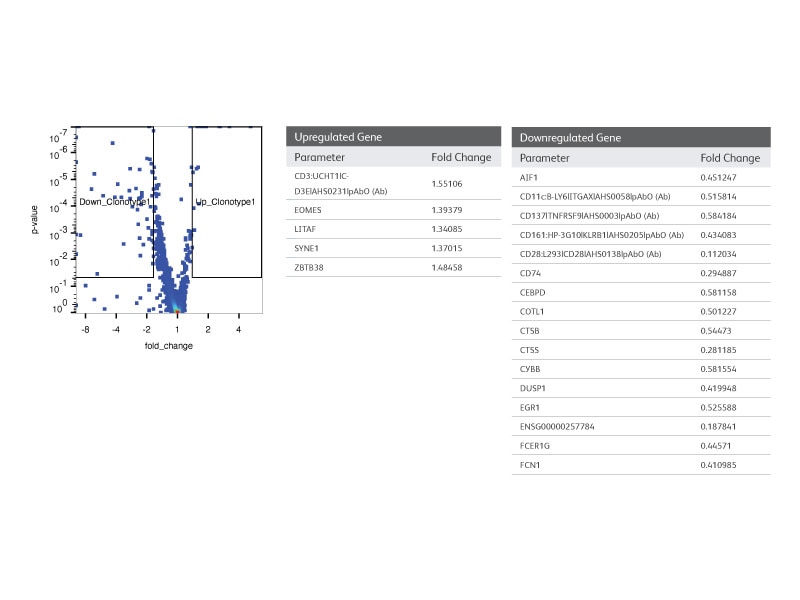
Using WTA and AbSeq information, differential gene and protein expression analysis of cells with the most frequent clonotype vs the rest of the population were performed.

Step 6:
Cell IDs and chain information were obtained from the pipeline output files and VDJ and C gene information were determined for the clonotype of interest.
| Cell Index | TCR Alpha Gamma V gene dominant | TCR Alpha Gamma J gene dominant | TCR Alpha Gamma CDR3 translation dominant | TCR Beta Delta V gene dominant | TCR Beta Delta D gene dominant | TCR Beta Delta J gene dominant | TCR Beta Delta C gene dominant | TCR Beta Delta CDR3 translation dominant | TCR Paired Chains | Cell type experimental | High quality cell |
|---|---|---|---|---|---|---|---|---|---|---|---|
| 236563 | TRAV41*01 | TRAJ49*01 | AVRSGGDTGNQFY | TRBV5‑6*01 | TRBD2*02 | TRBJ2‑1*01 | TRBC2 | ASSLREYNEQF | TRUE | T_CD8_naive | TRUE |
| 638393 | TRAV41*01 | TRAJ49*01 | AVRSGGDTGNQFY | TRBV5‑6*01 | TRBD2*02 | TRBJ2‑1*01 | TRBC2 | ASSLREYNEQF | TRUE | T_CD8_naive | TRUE |
| 1789392 | TRAV41*01 | TRAJ49*01 | AVRSGGDTGNQFY | TRBV5‑6*01 | TRBD2*02 | TRBJ2‑1*01 | TRBC2 | ASSLREYNEQF | TRUE | T_CD8_naive | TRUE |
| 2461787 | TRAV41*01 | TRAJ49*01 | AVRSGGDTGNQFY | TRBV5‑6*01 | TRBD2*02 | TRBJ2‑1*01 | TRBC2 | ASSLREYNEQF | TRUE | T_CD8_naive | TRUE |
Step 7:
Full-length sequence of the clonotype was obtained (nucleotide sequence also available) from the pipeline output.
| Cell Index | VDJ Translation Trimmed |
|---|---|
| 236563 | KNEVEQSPQNLTAQEGEFITINCSYSVGISALHWLQQHPGGGIVSLFMLSSGKKKHGRLIATINIQEKHSSLHITASHPRDSAVYICAVRSGGDTGNQFYFGTGTSLTVIP |
| 236563 | DAGVTQSPTHLIKTRGQQVTLRCSPKSGHDTVSWYQQALGQGPQFIFQYYEEEERQRGNFPDRFSGHQFPNYSSELNVNALLLGDSALYLCASSLREYNEQFFGPGTRLTVL |
| 638393 | KNEVEQSPQNLTAQEGEFITINCSYSVGISALHWLQQHPGGGIVSLFMLSSGKKKHGRLIATINIQEKHSSLHITASHPRDSAVYICAVRSGGDTGNQFYFGTGTSLTVIP |
| 638393 | DAGVTQSPTHLIKTRGQQVTLRCSPKSGHDTVSWYQQALGQGPQFIFQYYEEEERQRGNFPDRFSGHQFPNYSSELNVNALLLGDSALYLCASSLREYNEQFFGPGTRLTVL |
| 1789392 | KNEVEQSPQNLTAQEGEFITINCSYSVGISALHWLQQHPGGGIVSLFMLSSGKKKHGRLIATINIQEKHSSLHITASHPRDSAVYICAVRSGGDTGNQFYFGTGTSLTVIP |
| 1789392 | DAGVTQSPTHLIKTRGQQVTLRCSPKSGHDTVSWYQQALGQGPQFIFQYYEEEERQRGNFPDRFSGHQFPNYSSELNVNALLLGDSALYLCASSLREYNEQFFGPGTRLTVL |
| 2461787 | KNEVEQSPQNLTAQEGEFITINCSYSVGISALHWLQQHPGGGIVSLFMLSSGKKKHGRLIATINIQEKHSSLHITASHPRDSAVYICAVRSGGDTGNQFYFGTGTSLTVIP |
| 2461787 | DAGVTQSPTHLIKTRGQQVTLRCSPKSGHDTVSWYQQALGQGPQFIFQYYEEEERQRGNFPDRFSGHQFPNYSSELNVNALLLGDSALYLCASSLREYNEQFFGPGTRLTVL |
| TCR_alpha | KNEVEQSPQNLTAQEGEFITINCSYSVGISALHWLQQHPGGGIVSLFMLSSGK KKHGRLIATINIQEKHSSLHITASHPRDSAVYICAVRSGGDTGNQFYFGTGTSLTVIP |
| TCR_beta | DAGVTQSPTHLIKTRGQQVTLRCSPKSGHDTVSWYQQALGQGPQFIFQYYEEEERQRGNFPDRFSGHQFPNYSSELNVNALLLGDSALYLCASSLREYNEQFFGPGTRLTVL |
-
Brochure
-
Protocols (Human)
-
BD Rhapsody™ System TCR/BCR Next and Targeted mRNA Library Preparation Protocol
-
BD Rhapsody™ System TCR/BCR Next, Targeted mRNA, and Sample Tag Library Preparation Protocol
-
BD Rhapsody™ System TCR/BCR Next, Targeted mRNA, and BD® AbSeq Library Preparation Protocol
-
BD Rhapsody™ System TCR/BCR Next, Targeted mRNA, BD® AbSeq, and Sample Tag Library Preparation Protocol
-
BD Rhapsody™ System TCR/BCR Next and mRNA Whole Transcriptome Analysis (WTA) Library Preparation Protocol
-
BD Rhapsody™ System TCR/BCR Next, mRNA Whole Transcriptome Analysis (WTA), and Sample Tag Library Preparation Protocol
-
BD Rhapsody™ System TCR/BCR Next, mRNA Whole Transcriptome Analysis (WTA), and BD® AbSeq Library Preparation Protocol
-
BD Rhapsody™ System TCR/BCR Next, mRNA Whole Transcriptome Analysis (WTA), BD® AbSeq, and Sample Tag Protocol
-
Protocols (Mouse)
-
BD Rhapsody™ System Mouse TCR/BCR Next and Targeted mRNA Library Preparation Protocol
-
BD Rhapsody™ System Mouse TCR/BCR Next, Targeted mRNA, and Sample Tag Library Preparation Protocol
-
BD Rhapsody™ System Mouse TCR/BCR Next, Targeted mRNA, and BD® AbSeq Library Preparation Protocol
-
BD Rhapsody™ System Mouse TCR/BCR Next, Targeted mRNA, BD® AbSeq, and Sample Tag Library Preparation Protocol
-
BD Rhapsody™ System Mouse TCR/BCR Next and mRNA Whole Transcriptome Analysis (WTA) Library Preparation Protocol
-
BD Rhapsody™ System Mouse TCR/BCR Next, mRNA Whole Transcriptome Analysis (WTA), and BD® AbSeq Library Preparation Protocol
-
BD Rhapsody™ System Mouse TCR/BCR Next, mRNA Whole Transcriptome Analysis (WTA), and Sample Tag Library Preparation Protocol
-
BD Rhapsody™ System Mouse TCR/BCR Next, mRNA Whole Transcriptome Analysis (WTA), BD® AbSeq, and Sample Tag Protocol
For Research Use Only. Not for use in diagnostic or therapeutic procedures.
