BD Pharmingen™ MitoStatus Red
(RUO)
Recommended Assay Procedures
Preparation
Bring one 50 μg vial of BD Pharmingen™ MitoStatus Red dye powder and fresh cell culture-grade Dimethyl Sulfoxide (DMSO; eg, Sigma D2650) to room temperature. To reconstitute BD Pharmingen™ MitoStatus Red dye powder in DMSO at a stock concentration of 0.2 mM, add 460 μL of DMSO to one vial of dye powder.
Storage
Upon arrival, store the dye powder desiccated and protected from light at ≤ -20°C until use. The dye powder is stable for at least 12 months if stored as indicated. After reconstitution with DMSO, store the stock solution at ≤ -20°C in small aliquots. The stock solution is stable for at least 6 months if stored as indicated.
Cytometry Requirements
Before staining with this reagent, please confirm that your flow cytometer is capable of exciting the fluorochrome and discriminating the resulting fluorescence. Flow Cytometers (eg, BD FACSCanto™ II, BD LSRFortessa™, BD™ LSR II, or BD Accuri™ C6) equipped with a red laser (eg, 633 nm) can be used. This dye can be read out of filters commonly used for APC or Alexa Fluor® 647 (e.g., 660/20 or 670/30).
Fluorescence compensation is best achieved using a sample of the cells of interest. When designing multicolor fluorescent staining panels, please be aware of high spillover into the following fluorochromes' detectors: Alexa Fluor® 700, APC-H7, PerCP-Cy™5.5, BV711, or BV786. We recommend titrating the dye and using the lowest possible concentration that provides adequate resolution of polarized and depolarized populations for the cell type of interest to reduce spillover.
Procedure
BD Pharmingen™ MitoStatus Red labeling of suspended cells for flow cytometric analysis
1. Count cells to determine cell density. Adjust cell density to 1 × 10^6 cells/ml or less in fresh, pre-warmed cell culture media.
2. Stain cells in fresh, pre-warmed cell culture media or desired stain buffer with 20-200 nM BD Pharmingen™ MitoStatus Red in a polypropylene container by adding the stock solution directly to the cells at the desired concentration.
a. Note: BD Pharmingen™ MitoStatus Red may also be added directly to the culture instead of staining in fresh media. Staining may also be performed in pre-warmed BD Pharmingen™ Stain Buffer (FBS) (Cat. No. 554656) or pre-warmed Dulbecco's PBS. DPBS may provide increased resolution for some cell types, but can also result in increased background staining.
b. Note: To aid in flow cytometric gating, we recommend using control cells treated with vehicle alone and/or a mitochondrial uncoupler, such as FCCP [Carbonyl cyanide 4 (trifluoromethoxy)phenylhydrazone, eg, Sigma Cat. No. C2920].
3. Incubate samples for 15-30 minutes at 37°C protected from light.
4. Wash cells twice with BD Pharmingen™ Stain Buffer (FBS) (Cat. No. 554656).
5. Decant the supernatant and gently mix to disrupt the cell pellet.
6. Resuspend the cells in Stain Buffer (FBS).
7. Analyze cells by flow cytometry. Alternatively, counterstain cells with compatible fluorescent dyes or antibodies as desired and then analyze.
BD Pharmingen™ MitoStatus Red labeling of adherent cells for flow cytometry
1. Adherent cells should be stained in situ at 70% confluence or less. Stain cells in fresh, pre-warmed cell culture media or desired stain buffer with 20-200 nM BD Pharmingen™ MitoStatus Red by adding the stock solution directly to the cells at the desired concentration.
a. Note: BD Pharmingen™ MitoStatus Red may also be added directly to the culture instead of staining in fresh media. Staining may also be performed in pre-warmed BD Pharmingen™ Stain Buffer (FBS) or pre-warmed DPBS. DPBS may provide increased resolution for some cell types, but can also result in increased background staining.
b. Note: To aid in flow cytometric gating, we recommend using control cells treated with vehicle alone and/or a mitochondrial uncoupler, such as FCCP.
2. Incubate samples for 15-30 minutes at 37°C protected from light.
3. Wash cells twice with BD Pharmingen™ Stain Buffer (FBS).
4. Remove cells from the growth medium. We recommend using BD™ Accutase™ Cell Detachment Solution (Cat. No. 561527).
5. Wash cells twice with BD Pharmingen™ Stain Buffer (FBS).
6. Decant the supernatant and gently mix to disrupt the cell pellet.
7. Resuspend the cells in Stain Buffer (FBS) or equivalent.
8. Analyze cells by flow cytometry. Alternatively, counterstain cells with compatible fluorescent dyes or antibodies as desired and then analyze.
Notes:
1. This dye is not compatible with fixation.
2. Each user should determine the optimal concentrations of reagents, cells, and conditions for the assay of interest. We recommend titrating the reagent in early experiments to obtain optimal results.
3. Cells may be stained in bulk prior to staining with fluorescent antibodies.
BD Pharmingen™ MitoStatus Red labeling of cells for fluorescent imaging
1. Stain cells in fresh, pre-warmed media with 20-200 nM BD Pharmingen™ MitoStatus Red.
2. Incubate samples for 15-30 minutes at 37°C protected from light.
3. Remove the staining solution and replace with pre-warmed PBS.
4. Analyze cells by fluorescence imaging. Alternatively, counterstain cells with compatible fluorescent dyes or antibodies as desired and then analyze.
Product Notices
- Since applications vary, each investigator should titrate the reagent to obtain optimal results.
- Accutase is a registered trademark of Innovative Cell Technologies, Inc.
- Alexa Fluor® is a registered trademark of Molecular Probes, Inc., Eugene, OR.
- For fluorochrome spectra and suitable instrument settings, please refer to our Multicolor Flow Cytometry web page at www.bdbiosciences.com/colors.
- Cy is a trademark of GE Healthcare.
- Before staining with this reagent, please confirm that your flow cytometer is capable of exciting the fluorochrome and discriminating the resulting fluorescence.
- Please refer to www.bdbiosciences.com/us/s/resources for technical protocols.
Companion Products
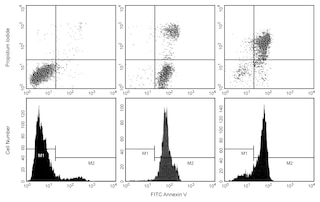
In cells undergoing apoptosis, oxidative stress, necrosis, and other cellular processes, the mitochondrial membrane potential (Δψm) can become depolarized. For example, in cells undergoing apoptosis, pro-apoptotic Bcl-2 family proteins cause mitochondrial outer membrane permeabilization (MOMP), resulting in the release of cytochrome C and the subsequent activation of caspase-9 and the apoptotic cascade. MOMP often correlates with the loss of inner mitochondrial membrane potential (Δψm), which can be detected using Δψm-sensitive dyes. These cationic, lipophilic dyes accumulate within the mitochondria of healthy cells, but not within mitochondria that have lost Δψm due to induction of apoptosis or treatment with a mitochondrial uncoupler.
BD Pharmingen™ MitoStatus Red is a fluorescent dye that is readily sequestered by active mitochondria, allowing for flow cytometric or imaging analysis to assess for apoptosis or mitochondrial depolarization. Apoptotic or cells with depolarizard mitochondria will have diminished levels of fluorescence. MitoStatus Red has an excitation maximum of 622 nm and an emission maximum of 648 nm.
BD Pharmingen™ MitoStatus Red (Cat. No. 564697) is provided as 2 vials at 50 µg each.
Development References (7)
-
Ehrenberg B, Montana V, Wei MD, Wuskell JP, Loew LM. Membrane potential can be determined in individual cells from the nernstian distribution of cationic dyes. Biophys J. 1988; 53(5):785-794. (Methodology). View Reference
-
Gottlieb E, Vander Heiden MG, Thompson CB. Bcl-x(L) prevents the initial decrease in mitochondrial membrane potential and subsequent reactive oxygen species production during tumor necrosis factor alpha-induced apoptosis. Mol Cell Biol. 2000; 20(15):5680-5689. (Biology). View Reference
-
Lemasters JJ, Nieminen AL, Qian T, et al. The mitochondrial permeability transition in cell death: a common mechanism in necrosis, apoptosis and autophagy. Biochim Biophys Acta. 1998; 1366(1-2):177-196. (Biology: Cell culture). View Reference
-
Li PF, Dietz R, von Harsdorf R. p53 regulates mitochondrial membrane potential through reactive oxygen species and induces cytochrome c-independent apoptosis blocked by Bcl-2. EMBO J. 1999; 18(21):6027-6036. (Biology). View Reference
-
Perry SW, Norman JP, Barbieri J, Brown EB, Gelbard HA. Mitochondrial membrane potential probes and the proton gradient: a practical usage guide. Biotechniques. 2011; 50(2):98-115. (Methodology). View Reference
-
Rottenberg H, Wu S. Quantitative assay by flow cytometry of the mitochondrial membrane potential in intact cells. Biochim Biophys Acta. 1998; 1404(3):393-404. (Methodology). View Reference
-
Scaduto RC Jr, Grotyohann LW. Measurement of mitochondrial membrane potential using fluorescent rhodamine derivatives. Biophys J. 1999; 76(1.1):469-477. (Methodology). View Reference
Please refer to Support Documents for Quality Certificates
Global - Refer to manufacturer's instructions for use and related User Manuals and Technical data sheets before using this products as described
Comparisons, where applicable, are made against older BD Technology, manual methods or are general performance claims. Comparisons are not made against non-BD technologies, unless otherwise noted.
For Research Use Only. Not for use in diagnostic or therapeutic procedures.