
T lymphocytes have been at the forefront of research in the past decade due to our increasing understanding of their role in the clearance of pathogens, their application in immunotherapy, and the association of their dysregulation with a variety of diseases. A key example is seen with the depletion of T cells, mediated by infections such as from human immunodeficiency virus (HIV) and the severe secondary immune deficiencies that develop, such as acquired immune deficiency syndrome (AIDS).1 In healthy humans, mature T cells and T regulatory cells (Tregs) help in maintaining peripheral immune tolerance, preventing autoimmunity against self antigens. Of recent interest have been immune checkpoint inhibitors targeting T cell receptors, such as PD-1 and CTLA-4, which have been successful in un-inhibiting T cell activation and proliferation of antigen-experienced T cells in the tumor microenvironment. This strategy has been used successfully in treatment against melanoma and other tumors.2 Chimeric antigen receptor (CAR)-T cells, such as anti-CD19 CAR-T cells, have been extremely successful (approximately 93% response) against B cell malignancies, such as acute lymphoblastic leukemia.2 Flow cytometry provides a powerful tool for immunophenotyping and analyzing T cells, furthering insights in each of these fields.
The origin and development of T cells
T cells originate in the bone marrow and travel to the thymus for their maturation. Characteristic markers of T cells are their T cell receptor (TCR) and a ubiquitous member of the TCR complex, CD3. They can further be subsetted into two predominant types by the expression of other surface molecules, CD4 (CD4+ or helper T cells) and CD8 (CD8+ or cytotoxic T cells).3
Types of T cells
Helper T cells
Helper T (Th) cells are essential regulators of adaptive immune responses and inflammatory diseases. A subgroup of lymphocytes, helper T cells play an important role in establishing and maximizing the capabilities of the immune system. These cells are unusual in that they have little or no cytolytic or phagocytic activity. However, they are involved in activating and directing other immune cells.
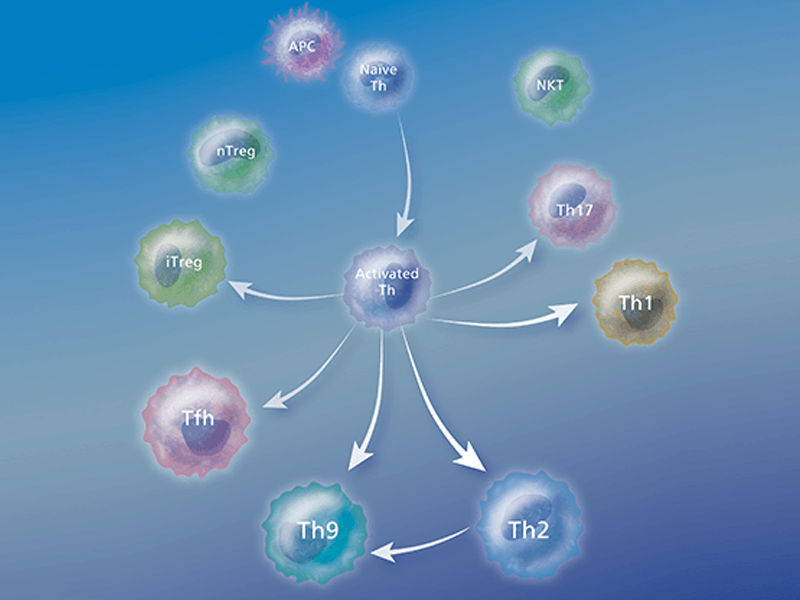
After activation by professional antigen-presenting cells (APCs) such as dendritic cells, macrophages and B cells, antigen-specific CD4+ T cells differentiate into effector cells that are specialized in terms of the cytokines and effector molecules that they express on their membranes or secrete and their discrete effector functions. Several types of Th cells have been recognized:
Th1 cells
Th1 cells are involved in the cellular immune response and host defense against intracellular pathogens. These molecules are characterized by the production of pro-inflammatory cytokines like IFN-γ, IL-2 and lymphotoxin-α (LTα). Th1 cells are centrally involved in cell-mediated immunity. The cytokines produced by Th1 cells stimulate the phagocytosis and destruction of microbial pathogens by macrophages and other lymphocytes. Several chronic inflammatory diseases have been described as Th1-dominant diseases including multiple sclerosis, diabetes and rheumatoid arthritis.
Th2 cells
Th2 cells are involved in the humoral immune response and host defense against extracellular parasites. These cells are characterized by the production of IL-4, IL-5, IL-6, IL-10 and IL-13. Th2 cells are thought to play a role in allergic responses. Cytokines like IL-4 generally stimulate the production of antibodies directed toward large extracellular parasites, while IL-5 stimulates eosinophil response toward large extracellular parasites. Allergy and atrophy are thought to be Th2-dominant conditions. Th2 cells have historically been thought to be the source of IL-9. However, recent publications suggest the existence of a Th2-related cell type that is characterized by the secretion of IL-9 and IL-10. These so-called Th9 cells can differentiate from Th2 cells in the presence of TGF-β or they can differentiate from a naïve CD4 cell with a combination of IL-4 and TGF-β. These cells may be involved in asthma and tissue inflammation.
The balance between Th1 and Th2 cells
When Th1 cells produce IFN-γ, this prompts macrophages to produce TNF and toxic forms of oxygen, which destroy the microorganisms within the phagosomes and lysosomes. On the other hand, when Th2 cells produce IL-4 and IL-10, these cytokines block the microbial killing that is activated by IFN-γ. The Th1/Th2 relationship has also been investigated with regards to transplantation. Th1 responses have been implicated in most forms of acute graft or transplant rejection and graft-versus-host (GVHD) disease, while Th2 responses have been variably associated with either protection or chronic rejection. However, cloned Th1 or Th2 cells have a similar capacity to reject skin grafts in experimental models, and Tr1/Treg cells are now being implicated in protection and tolerance induction. The fetus is also analogous to an allograft, and Th2 or Treg responses are thought to be protective, while Th1 may lead to resorption or spontaneous abortion. 4
Th17 cells
Th17 cells are involved in inflammation and host defense against extracellular pathogens. A subset of helper T cells that produce IL-17A, Th17 cells has been shown to play an important role in the induction of autoimmune tissue injury. They are distinct from Th1 or Th2 cells since they do not produce classical Th1 or Th2 cytokines such as IFN-γ or IL-4. They play a key role in mouse models of autoimmunity, and it has been suggested that the differentiation pathway from a naïve T-helper cell to a Th17 cell involves a combination of TGF-β and IL-6. RORγt is a key transcription factor involved in induction of Th17 cells. Some RORγt expression is induced in response to IL-6 or TGF-β, but the generation of Th17 cells requires TGF-β as well as IL-6.
Furthermore, it is believed that the relative balance of IL-6 and TGF-β in steady state would tilt the balance in favor of either Th17 or Treg differentiation in diverse tissues. Induction of the Th17 subset requires TGF-β and IL-6, while amplification of IL-17A–producing cells is dependent upon TGF-β and IL-21. Maintenance of a Th17 response primarily depends on IL-23 (p19/p40). IL-23 binds to the IL-23 receptor that triggers downstream activation of STAT3 and subsequent upregulation of ROR-γ and production of IL-17A.
Since IL-17A leads to the induction of many pro-inflammatory factors such as TNF, IL-6 and IL-1β, it has been suggested that Th17 cells might be responsible for the development and/or progression of autoimmune diseases such as experimental autoimmune encephalomyelitis (EAE) and colitis.
Regulatory T cells
Regulatory T cells (Tregs) play an important role in maintaining immune homeostasis.2 Tregs suppress the function of other T cells to limit the immune response. Alterations in the number and function of Tregs has been implicated in several autoimmune diseases including multiple sclerosis, active rheumatoid arthritis and type 1 diabetes. High levels of Tregs have been found in many malignant disorders including lung, pancreas and breast cancers. Tregs may also prevent antitumor immune responses,5 leading to increased mortality.
As published data on the immunosuppressive potential of regulatory T cells (Tregs) has accumulated, enthusiasm for their potential application has intensified. Thus, Treg research is very active and new publications emerge almost daily. Today, commonly used markers for Treg identification, isolation and characterization are CD4, CD25, CD127 and FoxP3. However, new targets with functional significance such as CD39, CD45RA, CTLA-4 and others are rapidly emerging.
CD4 and CD8 Tregs
Two major classes of Tregs have been identified to date: CD4 and CD8 Tregs. CD4 Tregs consist of two types—natural Tregs (nTregs) that constitutively express CD25 and FoxP3 and so-called adaptive or inducible Tregs (iTregs).
Natural Tregs originate from the thymus as CD4+ cells expressing high levels of CD25 together with the transcription factor (and lineage marker) FoxP3. nTregs represent approximately 5–10% of the total CD4+ T cell population and can first be seen at the single-positive stage of T lymphocyte development.6, 7 They are positively selected thymocytes with a relatively high avidity for self-antigens. The signal to develop into Treg cells is thought to come from interactions between the T cell receptor and the complex of MHC II with self peptide expressed on the thymic stroma.5 nTregs are essentially cytokine independent.
Adaptive or inducible Tregs originate from the thymus as single-positive CD4 cells. They differentiate into CD25 and FoxP3 expressing Tregs (iTregs) following adequate antigenic stimulation in the presence of cognate antigen and specialized immunoregulatory cytokines such as TGF-β, IL-10 and IL-4.8
FoxP3 is currently the most accepted marker for Tregs,9 although there have been reports of small populations of FoxP3- Tregs. The discovery of transcription factor FoxP3 as a marker for Tregs has allowed scientists to better define Treg populations leading to the discovery of additional Treg markers including CD127.10
CD127 Cells
CD127 is part of the heterodimeric IL-7 receptor that is composed of CD127 and the common gamma chain, which is shared by other cytokine receptors (IL-2R, IL-4R, IL-9R, IL-15R and IL-21R). CD127 is expressed on thymocytes, T and B cell progenitors, mature T cells, monocytes and some other lymphoid and myeloid cells. Studies have shown that IL-7R plays an important role in the proliferation and differentiation of mature T cells, and in vitro experiments show that the expression of CD127 is downregulated following T cell activation.11 It is believed that FoxP3 interacts with the CD127 promoter and might contribute to reduced expression of CD127 in Tregs.
References
- McCune JM. The dynamics of CD4+ T-cell depletion in HIV disease. Nature. 2001;410(6831):974-979. doi: 10.1038/35073648
- Todryk S, Jozwik A, de Hayilland J, Hester J. Emerging cellular therapies: T cells and beyond. Cells. 2019;8:284. doi:10.3390/cells8030284
- Mousset CM, Hobo W, Woestenenk R, Preijers F, Dolstra H, van der Waart AB. Comprehensive phenotyping of T cells using flow cytometry. Cytometry A. 2019;95(6):647-654. doi:10.1002/cyto.a.23724
- Qian J, Zhang N, Lin J, et al. Distinct pattern of Th17/Treg cells in pregnant women with a history of unexplained recurrent spontaneous abortion. Biosci Trends. 2018;12(2):157-167. doi:10.5582/bst.2018.01012
- Overacre-Delgoffe AE, Chikina M, Dadey RE, et al. Interferon-γ drives Treg fragility to promote anti-tumor immunity. Cell. 2017;169(6):1130-1141.e11. doi:10.1016/j.cell.2017.05.005
- Workman CJ, Szymczak-Workman AL, Collison LW, Pillai MR, Vignali DA. The development and function of regulatory T cells. Cell Mol Life Sci. 2009;66(16):2603-2622. doi:10.1007/s00018-009-0026-2
- Schiavon V, Duchez S, Branchtein M, et al. Microenvironment tailors nTreg structure and function. Proc Natl Acad Sci U S A. 2019;116(13):6298-6307. doi:10.1073/pnas.1812471116
- Liu M, Li S, Li MO. TGF-β control of adaptive immune tolerance: a break from Treg cells. Bioessays. 2018;40(11):e1800063. doi:10.1002/bies.201800063
- Lu L, Barbi J, Pan F. The regulation of immune tolerance by FOXP3. Nat Rev Immunol. 2017;17(11):703-717. doi:10.1038/nri.2017.75
- Rodríguez-Perea AL, Arcia ED, Rueda CM, Velilla PA. Phenotypical characterization of regulatory T cells in humans and rodents. Clin Exp Immunol. 2016;185(3):281-291. doi:10.1111/cei.12804
- Di Caro V, D'Anneo A, Phillips B, et al. Interleukin-7 matures suppressive CD127(+) forkhead box P3(FoxP3)(+) T cells into CD127(-) CD25(high) FoxP3(+) regulatory T cells. Clin Exp Immunol. 2011;165(1):60-76. doi: 10.1111/j.1365-2249.2011.04334.x
BD Biosciences provides a comprehensive portfolio of reagents and kits to study T cells
Among the methods used for studying T cells, multicolor flow cytometry is preeminent because it enables the characterization of highly complex T cell subpopulations—both functionally and phenotypically. Complementary technologies such as ELISA, ELISPOT and bead-based immunoassays also further research in the T cell area, offering flexibility to meet a range of experimental needs and multiple methods to verify results.
The following table lists important characteristics of tools and technologies to support your T cell research and help you find the ones that meet your experimental needs. Certain technologies can reveal specific information about a sample or might better meet practical needs such as the available instrumentation or sample type. In some cases, researchers can use the combined information from multiple techniques to verify results. Different approaches can paint a detailed picture of the mechanisms contributing to T cell development.
| Tool/Technology | Flow Cytometry: Surface | Flow Cytometry: Introcellular | BD® Cytometric Bead Array (CBA) | ELISPOT | ELISA | In Vivo Capture Assay |
|---|---|---|---|---|---|---|
| Molecules detected | Surface | Intracellular and surface | Secreted or intracellular | Secreted (in situ) | Secreted | Secreted (in vivo) |
| Multiparameter | Yes | Yes | Yes | No | No | No |
| Single cell/cell subset information | Yes | Yes | No | Frequencies, no subset information | No | No |
| Antigen-specific | Yes | Yes | Yes | Yes | Yes | Yes |
| Post-assay viability | Yes | No | Yes, for secreted molecules | No | Yes | Yes |
| Quantitation of protein | Possible* | Possible* | Yes | No | Yes | Yes |
| Instrumentation | Flow cytometer | Flow cytometer | Flow cytometer | ELISPOT reader | Spectrophotometer | Spectrophotometer |
*With a standard such as BD Quantibrite™ Beads
Immunophenotyping: combining surface and intracellular markers
Using multicolor flow cytometry—and combining surface phenotyping with intracellular staining of cytokines, transcription factors or signaling molecules—you can identify individual T cell subsets based on their characteristic marker signature. BD advanced reagent systems, extensive marker selection and wealth of support tools help researchers simplify phenotyping and maximize the information obtained from individual samples.
Immunophenotyping by flow cytometry, a valuable research tool, uses the differential expression of cellular markers to isolate and characterize T cells and their subsets. T cells and their subsets can be defined by differential expression of cell surface markers including CD3, CD4, CD8 and CD25. Using panels of directly conjugated fluorescent antibodies to these specific markers, multicolor flow cytometric analysis allows researchers to interrogate the levels of multiple markers simultaneously on individual cells. This can provide information about the cell lineage and state of differentiation of cell subsets in a particular sample. Adding markers such as CCR7, CD62L or CD69 to an analysis provides important information about the potential for cells to home and localize within the body, as well as the activation status of the T cell subset of interest. By analyzing the expressed patterns of various markers—including not only cell surface receptors but also cytokine secretion profiles and intracellular signaling molecules—researchers have defined phenotypes that represent functionally distinct T cell subsets (e.g., Th1, Th2, Th17, Treg, Th9).
Major Known T Cell Markers
| Type of Cell | Cytotoxic | Th1 | Th2 | Th91 | Th17 | Tfh2 | Treg |
|---|---|---|---|---|---|---|---|
| Main Function | Kill virus-infected cells | Activate microbicidal function of infected macrophages and help B cells to produce antiboday | Help B cells and switch antibody isotope production | T cell proliferation and enhance IgG and IgE production by B cells | Enhance neutrophil response | Regulate development of antigen specific B cell development and antibody production | Immune regulation |
| Pathogens Targeted | Viruses and some | Inracelluar pathogens | Parasites | Parasites | Fungi and extracellular bacteria | ||
| Extracellular Markers | CD8 | CD4, CXCR3 | CD4, CCR4, Cith2 (human) | CD4 | CD4, CCR6 | CD4, CXCR5 | CD4, CD25 |
| Differentiation Cytokines | IFN-y, IL-2, IL-12, IL-18, IL-27 | IL-4, IL-2, IL-33 | IL-4, TGF-β | TGF-β, IL-6, IL-1, IL-21, IL-23 | IL-12, IL-6 | TGF-β, IL-12 | |
| Effector Cytokines | IFN-y, TNF, LT-α | IFN-y, LT-α, TNF | IL-4, IL-5, IL-6, IL-13 | IL-9, IL-10 | IL-17A, IL-17F, IL-21, IL-22, IL-26, TNF, CCL20 | IL-21 | TGF-β, IL-10 |
| Transcription Factors | T-bet, Stat1, Stat6 | GATA3, Stat5, Stat6 | GATA3, Smads, Stat6 | RORyet, RORα, Stat3 | Bci-6, MAF | FoxP3, Smad3, Stat5 |
Markers can be altered as a result of cellular environment, differentiation state, and other factors. Key cytokine appear in bold. BD Biosciences offers reagents for molecules that are green.
- Soroosh P. Doherty TA. Th9 and allergic disease. Immunology. 2009; 127(4):450-458. doi: 10.1111/j. 1365-2567.209.03114.x.
- Fazilleau N, Mark L, McHeyzer-Williams LJ, McHeyzer-Williams MG. Follicular helper T cells: lineage and location. Immunity. 2009;30(3):324-355. doi: 10.1016/j.immuni.2009.03.003.
View the panel sheet detailing a multicolor flow cytometry panel for the detection of major human circulating to detect CD4+ T cell subsets.
Isolation of selected cell populations by cell sorting
Defined cell populations can be isolated from complex cell mixtures by using a specific combination of surface markers and cell sorters, such as the BD FACSAria™ III, BD FACSMelody™ and BD FACSymphony™ S6 Flow Cytometry Systems. Purified, viable cell populations can be expanded, differentiated and maintained in culture. For certain applications, BD Biosciences scientists have worked out detailed protocols for sorting, such as a method of isolating human Treg cells by using CD4-enriched cells and sorting on the CD4 +CD25 int-hiCD127 low phenotype, which provides increased efficiency and higher yields.
Intracellular cytokine detection for the analysis of T cell subset-specific responses
Detection of intracellular cytokines using multicolor flow cytometry is a powerful tool to gain insight into the spectrum of responses within mixed populations of cells. By simultaneously measuring multiple cytokines and cell surface markers in one assay, this technique offers insight into which cell subset is producing which cytokines. For example, multicolor flow cytometry can be used to identify Th1, Th2 or Th17 cells based on their characteristic cytokine signatures. The cell-by-cell analysis allows researchers to analyze responses of distinct cell subsets without physically separating them.
Intracellular cytokine detection systems
For intracellular protein detection, cells must be fixed and permeabilized to allow a fluorescent antibody to enter and detect the target protein of interest. Different antigens have different sensitivities to and requirements for fixation and permeabilization, entailing additional optimization of protocols. To detect cytokines, which are secreted proteins, protein transport inhibitors are required to trap proteins inside the cells. BD Biosciences offers two widely used assay systems for intracellular cytokine detection: BD Cytofix/Cytoperm™ Reagents and the BD FastImmune™ Cytokine System. Both systems offer researchers the ease and confidence of using tested reagents and protocols and incorporate the high standard of quality and reproducibility that BD flow cytometry products are known for. BD Phosflow™ Reagents help you use multicolor flow cytometry to reliably measure the level of phosphorylated proteins involved in T cell signaling and combine the data with subset identification.
BD Cytofix/Cytoperm™ Reagent method
The BD Cytofix/Cytoperm™ Reagent method and related reagents address the wide-ranging experimental needs of basic research. With products for a broad selection of cytokines and multiple species, BD Cytofix/Cytoperm™ Reagents offer maximum flexibility in intracellular cytokine staining. BD Biosciences offers several solutions for measuring intracellular cytokines through intracellular flow cytometry.
BD FastImmune™ System
The BD FastImmune™ System is designed to meet the needs of applied research on human samples. With a focus on complete systems, this approach is well suited for research studies monitoring immune status during disease or immune responses to vaccine candidates. The BD FastImmune™ CD4 Intracellular Cytokine Detection Kit Anti-Hu-TNF-α/CD69/CD4/CD3 is designed for the detection of intracellular cytokines and the activation marker CD69 in antigen-activated CD4+ T lymphocytes in whole blood. Applications include studies of T cell responses to antigens, such as herpes viruses, HIV and tumor antigens. BD Biosciences offers several solutions for measuring intracellular cytokines through intracellular flow cytometry.
Diagram showing stages of BD FastImmune™ Cytokine System acting on a sample.

BD FastImmune™ Cytokine System workflow overview.
Intracellular signaling
BD Phosflow™ Reagent technology offers an extremely powerful means of obtaining kinetic information on T cell subset-specific signaling processes.
T cells are activated and regulated by complex pathways involving several signal transduction molecules, including receptors for antigens and cytokines, kinases, and transcription factors. Signals involving protein phosphorylation play a role in the differentiation of naïve CD4+ T cells into Th1, Th2, Th9, Th17, Tfh or Treg cells.
Detecting transient phosphorylation events: BD Phosflow™ Reagent technology
Innovative BD Phosflow™ Reagent technology was the first complete flow cytometry solution to reveal intracellular data on basal and induced protein phosphorylation events in both cell lines and primary cells. The BD Phosflow™ Reagent approach is especially informative for studying T cells in which phosphorylation of signaling proteins leads to the expression of particular T cell phenotypes.
Secreted cytokines
For detection of secreted cytokines within a sample, BD offers multiple assays. BD® Cytometric Bead Array (CBA) technology allows quantitation of multiple soluble cytokines simultaneously, while BD OptEIA™ ELISA Reagents are designed for quantitation of single cytokines. BD® ELISPOT Reagents enable determination of the frequency of cytokine-producing cells, and BD® In Vivo Capture Assays allow quantitation by directly capturing cytokines in vivo.
Regulatory T cell monitoring
FoxP3 staining
FoxP3 (also known as Scurfin, IPEX and JM2) is a transcriptional repression factor of the forkhead or winged helix family of transcription factors.1 FoxP3 has been found to be expressed in all CD4+ Treg cells that have regulatory activity. Mutations in FoxP3 are associated with the inherited auto-immune diseases Scurfy in mice and its human counterpart, IPEX (immune dysregulation, polyendocrinopathy, and enteropathy X-linked syndrome).
FoxP3 is useful for confirming purity and yield of isolated Tregs or for characterizing fixed Treg cells. However, it is not suitable for use in isolating viable Treg cells, since FoxP3 staining requires fixation and permeabilization of the cells. In these cases, the CD25+CD127- surface signature is a better solution. Human FoxP3 monoclonal antibody clone 259D/C7 from BD Biosciences reacts with all currently identified isoforms of the human FoxP3 transcription factor and is cross-reactive with cynomolgus, rhesus and baboon.

The BD Pharmingen™ Human FoxP3 Antibody, available in multiple sizes and conjugates, is a reagent for the detection of FoxP3 positive Tregs. An easy-to-use buffer system allows researchers to fix and permeabilize cells in just a few simple steps, with the option of freezing samples up to 72 hours. While FoxP3 is a commonly used marker for Treg identification, isolation and characterization, Tregs are a very active area of research, and an emerging list of targets has been published in the literature. To support these emerging discoveries, the BD Biosciences portfolio of new high-quality reagents and solutions continues to grow.
CD39: Enhanced characterization of Tregs
Previously localized primarily on B cells, dendritic cells and certain subsets of T cells, CD39 has recently been shown to be co-expressed with FoxP3 in CD4+ Tregs in humans and mice.2 This discovery is adding to the growing list of cell surface markers such as CD25, CD45RA, HLA-DR and CTLA-4, that are important in the identification and functional characterization of CD4+ Tregs.
Extracellular ATP and its metabolites are potent regulatory molecules modulating a broad range of cell and organ functions. Cellular ATP release is an indicator of tissue destruction and a danger signal that activates the immune response. CD39 hydrolyzes extracellular ATP (or other triphosphates) into its respective nucleotides such as AMP. Extracellular nucleoside monophosphates are, in turn, rapidly degraded to nucleosides (e.g., adenosine) by soluble or membrane bound ecto-5′ nucleotidases (CD73). Pericellular adenosine then mediates anti-inflammatory T cell responses. Co-expression of CD39 and CD73 is thought to be one of the key mechanisms of immunosuppression mediated by Tregs.3
The BD Pharmingen™ Anti-Human CD39 (clone TÜ66) Monoclonal Antibody is a marker for human Tregs and is available as PE and APC conjugates in ready-to-use reagent kits for flow cytometry. TÜ66 recognizes ENTPD1, an ectoenzyme that belongs to the family of ectonucleoside triphosphate diphospho-hydrolases (E-NTPDases). The members of this family are involved in extracellular nucleotide catabolism, controlling the extracellular nucleoside triphosphate pool (NTPs).
CD152: CTLA4
Cytotoxic T lymphocyte antigen 4 (CTLA-4 or CD152) is critical for Treg suppressive function. Blockage of CD152 impairs the suppressive activities of Tregs. Abnormalities in CD152 expression have been reported to play a role in autoimmune diseases such as rheumatoid arthritis.2 The existence of defined populations, existing markers and emerging markers will greatly contribute to exciting new discoveries in Treg biology.

Treg enrichment
Tregs represent a small population of cells; enrichment is often necessary for downstream analysis. Several methods exist for the enrichment of whole or subpopulations of Tregs. While FoxP3 currently is considered the most accepted marker for Tregs, its intracellular localization prohibits its use for the isolation of viable Tregs. Other markers used for enrichment are either negative, positive or used in combination. One reported method of negative selection is the removal of cells expressing CD127 and CD49d. Cells expressing CD4+ and the highest levels of CD25 are used for positive selection. Combination methods can include the use of magnetic beads to remove contaminating populations prior to cell sorting. One of the most utilized approaches enriches for CD4+, CD25+, CD127- cells.

Enrichment of Tregs with CD4 and CD25
In humans, initial analysis of Treg populations revealed that only those ex vivo cells that express the highest levels of CD25, which represent approximately 2–3% of total CD4 T cells, demonstrate an in vitro suppressive activity in contrast to mouse cells in which all CD25 cells are considered Tregs. Furthermore, cells expressing low to intermediate levels of CD25 were thought not to exhibit any suppressive activity directly ex vivo.
Additionally, the definition of high and low levels of CD25 expression lacks consensus and has limited its use for obtaining viable human Tregs via flow cytometric cell sorting. As a result, many researchers only select cells with the highest expression of CD25, dramatically reducing the yield of isolated Tregs. These results intensified research to identify cells surface markers other than CD4 and CD25 that are exclusive to human Tregs.4
Magnetic based pre-enrichment of CD4+ T cells to increase yield of human Tregs
Peripheral blood mononuclear cells were isolated from a healthy donor and stained with a cocktail of surface markets (CD3, CD4, CD25, CD127, and CD45RA) for the detection and purification of Treg subsets. Lymphocytes and singlets were first gated based on light scatter properties followed by gating of CD3+CD4+ T cells (not shown). Tregs were identified as CD127low/neg CD25high. From the Treg gate, CD45RA+ naive and CD45RA- memory Tregs were identified and sorted at 5,000 events/sec in purity mode. Post-sort analysis revealed homogenous populations of memory and naive Tregs. Purified cells were then stained for additional surface markers (CD31, CD39 and CD15s) for immunophenotyping. CD31+ recent thymic emigrants (RTEs) were detected within CD45RA+ naive Tregs, whereas highly activated Tregs were detected within CD45RA- memory Tregs.

References
- Di Caro V, D'Anneo A, Phillips B, et al. Interleukin-7 matures suppressive CD127(+) forkhead box P3 (FoxP3)(+) T cells into CD127(-) CD25(high) FoxP3(+) regulatory T cells. Clin Exp Immunol. 2011;165(1):60-76. doi:10.1111/j.1365-2249.2011.04334.x
- Tøndell A, Wahl SGF, Sponaas AM, Sørhaug S, Børset M, Haug M. Ectonucleotidase CD39 and checkpoint signalling receptor programmed death 1 are highly elevated in intratumoral immune cells in non-small-cell lung cancer. Transl Oncol. 2020;13(1):17-24. doi:10.1016/j.tranon.2019.09.003
- de Oliveira Bravo M, Carvalho JL, Saldanha-Araujo F. Adenosine production: a common path for mesenchymal stem-cell and regulatory T-cell-mediated immunosuppression. Purinergic Signal. 2016;12(4):595-609. doi:10.1007/s11302-016-9529-0
- Attias M, Al-Aubodah T, Piccirillo CA. Mechanisms of human FoxP3+ Treg cell development and function in health and disease. Clin Exp Immunol. 2019;197(1):36-51. doi:10.1111/cei.13290
-
Application Notes

-
 Delineation of Functional T reg Subsets Using Cell Surface Marker Expression - Panel Sheet
-
Detection of Intracellular Cytokines in T Lymphocytes using the BD FastImmune™ Assay on the BD FACSVerse™ System
-
Studying Mouse Thymocyte Development using Multiparametric Flow Cytometry: An Efficient Method to Improve an 8-Color Panel on the BD FACSVerse™ System
-
Brochures
-
Frequently Asked Questions
-
Product Information Sheets
-
BD® CBA Human and Mouse Th1/Th2/Th17 Kit
-
BD Pharmingen™ CD4+ T Cell Phenotyping Kits
-
BD Pharmingen™ Transcription Factor Buffer Set
-
BD Human Regulatory T Cell Cocktail (CD4/CD25/CD127)
-
Human CD39 Reagents
-
Human FoxP3
-
Human Th17 Research Products
-
Human and Mouse Reactive T-bet Monoclonal Antibodies
-
Mouse Foxp3
-
Mouse Th17 Reagents
-
Unique Markers for the Study of Human Activated Regulatory T Cells: GARP, LAP, and SATB1
-
Protocols
- Activation of Immune Cells for Cytokine Production
- BD Cytofix/Cytoperm Method for Immunofluorescent Staining of Intracellular Cytokines for Flow Cytometric Analysis
-
BD Pharmingen™ Transcription Factor Buffer Set, Cat. Nos. 562725, 562574
-
CD3 Plate Stimulation Protocol of Murine T Cells for the Detection of Activation Markers
-
Protocol for CD3 Stimulation of Human T Cells for the Detection of Activation Markers
-
Simultaneous Measurement of Cell Surface Markers with FoxP3 and Stat5 (pY694) in IL-2– Stimulated Human PBMCs using BD Cytofix™ Fixation Buffer and BD Phosflow™ Perm Buffer III
-
Webinars
-
Complete, Novel Reagent and Instrumentation Solutions for the Sorting of Viable, Functional Regulatory T Cells
-
Optimizing Intracellular Flow Cytometry: Simultaneous Detection of Cytokines and Transcription Factors
-
Simplify Immunophenotyping Using Kits & Templates on the BD Accuri™ C6 Flow Cytometer
-
Simultaneous Correlation of Cytokine Production with Treg and Th17 Cell Proliferation
For Research Use Only. Not for use in diagnostic or therapeutic procedures.
Cy is a trademark of Global Life Sciences Solutions Germany GmbH or an affiliate doing business as Cytiva.
Alexa Fluor is a trademark of Life Technologies Corporation.