Skip to main content Skip to navigation
APC Rat Anti-Mouse IgG1
Flow cytometric analysis of mouse CD22.2 and rat CD45RA expression using APC Rat Anti-Mouse IgG1 antibody as a second step. Left Plot: CD22.2 expression on mouse splenocytes. BALB/c mouse splenic leucocytes were either not stained (control staining; dashed line histogram) or stained with Purified Mouse IgG1, κ Anti-Mouse CD22.2 antibody (solid line histogram). After washing, the cells were then stained with APC Rat Anti-Mouse IgG1 antibody (Cat. No. 550874) at 1 µg/test. The fluorescence histogram showing CD22.2 expression (or control staining) was derived from gated events with the forward and side light-scatter characteristics of intact leucocytes. Right Plot: CD45RA expression on rat splenocytes. Rat splenic leucocytes were either not stained (control staining; dashed line histogram) or stained with Purified Mouse IgG1, κ Anti- Rat CD45RA antibody (Cat. No. 554882; solid line histogram). After washing, the cells were then stained with APC Rat Anti-Mouse IgG1 antibody at 1 µg/test. The fluorescence histogram showing CD45RA expression (or control staining) was derived from gated events with the forward and side light-scatter characteristics of viable leucocytes.         Flow cytometry and data analysis was performed using a BD LSRFortessa™ X-20 Cell Analyzer System and FlowJo™ software. Data shown on this Technical Data Sheet are not lot specific.
Product Details
Down Arrow Up Arrow


BD Pharmingen™
Igh-4; Ighg1; Immunoglobulin heavy constant gamma 1
Mouse (QC Testing)
Rat LOU, also known as Louvain, LOU/C, LOU/M IgG1, κ
Mouse IgG1, κ Antibody
Flow cytometry (Routinely Tested)
0.2 mg/ml
16017
AB_398470
Aqueous buffered solution containing ≤0.09% sodium azide.
RUO


Preparation And Storage

Store undiluted at 4°C and protected from prolonged exposure to light. Do not freeze. The monoclonal antibody was purified from tissue culture supernatant or ascites by affinity chromatography. The antibody was conjugated to the dye under optimum conditions and unconjugated antibody and free dye were removed.

Recommended Assay Procedures

BD® CompBeads can be used as surrogates to assess fluorescence spillover (Compensation). When fluorochrome conjugated antibodies are bound to BD® CompBeads, they have spectral properties very similar to cells. However, for some fluorochromes there can be small differences in spectral emissions compared to cells, resulting in spillover values that differ when compared to biological controls. It is strongly recommended that when using a reagent for the first time, users compare the spillover on cells and BD CompBeads to ensure that BD® CompBeads are appropriate for your specific cellular application.

Product Notices

  1. Since applications vary, each investigator should titrate the reagent to obtain optimal results.
  2. An isotype control should be used at the same concentration as the antibody of interest.
  3. Caution: Sodium azide yields highly toxic hydrazoic acid under acidic conditions. Dilute azide compounds in running water before discarding to avoid accumulation of potentially explosive deposits in plumbing.
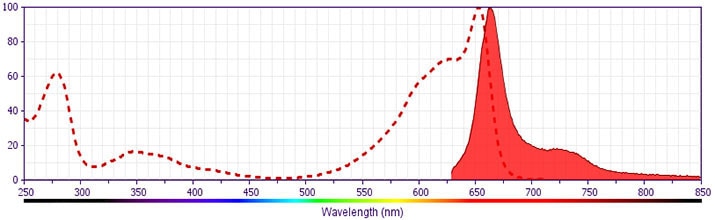
  4. This APC-conjugated reagent can be used in any flow cytometer equipped with a dye, HeNe, or red diode laser.
  5. For fluorochrome spectra and suitable instrument settings, please refer to our Multicolor Flow Cytometry web page at www.bdbiosciences.com/colors.
  6. Please refer to www.bdbiosciences.com/us/s/resources for technical protocols.
  7. Please refer to http://regdocs.bd.com to access safety data sheets (SDS).
  8. Species cross-reactivity detected in product development may not have been confirmed on every format and/or application.
550874 Rev. 7
Antibody Details
Down Arrow Up Arrow
X56

The X56 monoclonal antibody specifically binds to mouse IgG1 of Igh-C[a] and Igh-C[b] haplotypes. It does not crossreact with other Ig isotypes.

550874 Rev. 7
Format Details
Down Arrow Up Arrow
APC
Allophycocyanin (APC), is part of the BD family of phycobiliprotein dyes. This fluorochrome is a multimeric fluorescent phycobiliprotein with excitation maximum (Ex Max) of 651 nm and an emission maximum (Em Max) at 660 nm. APC is designed to be excited by the Red (627-640 nm) laser and detected using an optical filter centered near 660 nm (e.g., a 660/20 nm bandpass filter). Please ensure that your instrument’s configurations (lasers and optical filters) are appropriate for this dye.
altImg
APC
Red 627-640 nm
651 nm
660 nm
550874 Rev.7
Citations & References
Down Arrow Up Arrow

Development References (3)

  1. Hao Z, Duncan GS, Su YW, et al.. The E3 ubiquitin ligase Mule acts through the ATM-p53 axis to maintain B lymphocyte homeostasis. J Exp Med. 2012; 209(1):173-186. (Methodology: Flow cytometry). View Reference
  2. Kita-Furuyama M, Nagayama Y, Pichurin P, McLachlan SM, Rapoport B, Eguchi K. Dendritic cells infected with adenovirus expressing the thyrotrophin receptor induce Graves' hyperthyroidism in BALB/c mice. Clin Exp Immunol. 2003; 131(2):234-240. (Methodology: Flow cytometry). View Reference
  3. Vuong BQ, Lee M, Kabir S, et al. Specific recruitment of protein kinase A to the immunoglobulin locus regulates class-switch recombination.. Nat Immunol. 2009; 10(4):420-6. (Clone-specific: Flow cytometry). View Reference
550874 Rev. 7

Please refer to Support Documents for Quality Certificates


Global - Refer to manufacturer's instructions for use and related User Manuals and Technical data sheets before using this products as described


Comparisons, where applicable, are made against older BD Technology, manual methods or are general performance claims.  Comparisons are not made against non-BD technologies, unless otherwise noted.

For Research Use Only. Not for use in diagnostic or therapeutic procedures.