
The ability to analyze the expression of genes and proteins at the single-cell level via single-cell multiomics has now enabled deeper insights about cell behavior and function. Single-cell multiomics is now providing users the ability to analyze transcripts and proteins simultaneously across thousands of cells at the single-cell level in the same workflow. BD Biosciences’ multiomic tool, the BD Rhapsody™ Platform and its associated reagents, are all designed to facilitate and support your single-cell multiomic research.
BD Biosciences tools for single-cell multiomic analyses
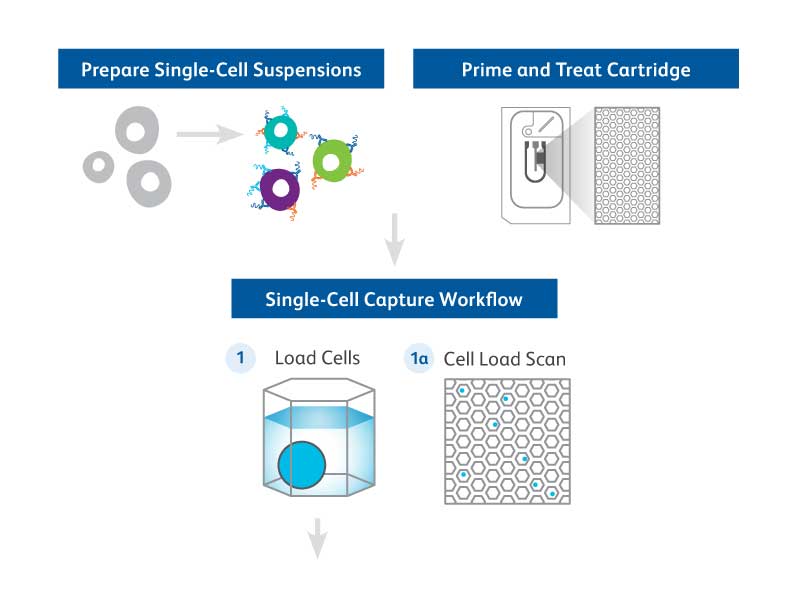
The BD Rhapsody™ Single-Cell Analysis System enables high-throughput single-cell multiomic analyses and includes a microwell-based instrument platform equipped with quality monitoring features; an array of RNA and protein assays such as BD Rhapsody™ Whole Transcriptome Assay, BD Rhapsody™ Targeted mRNA Panels and BD Rhapsody™ TCR/BCR Profiling Assays; BD® AbSeq Antibody-Oligo’s; and software tools. The BD Rhapsody™ System works seamlessly with other upstream BD cell enrichment technologies such as fluorescence-activated cell sorting enabling users to deep dive into their select cells of interest. Applications for BD single-cell multiomic technology covers a wide spectra of research areas, ranging from studies in immunology and immuno-oncology to understanding the molecular basis of metabolic diseases. The BD Rhapsody™ Platform is paving the way for researchers to apply multiomic tools to dive deep into their respective areas of research. The sections below highlight selected, key application data generated using the BD Rhapsody™ Platform.
Immuno-Oncology Research
Chronic Lymphocytic Leukemia Phenotyping
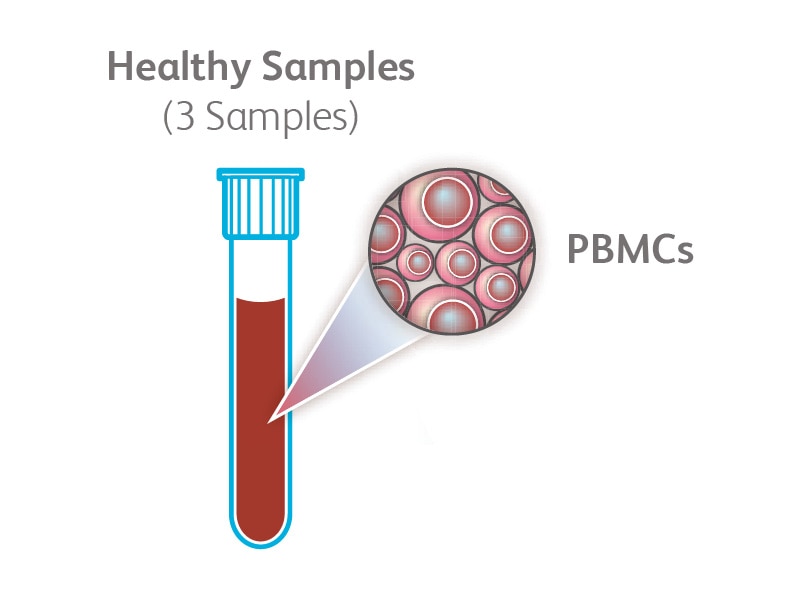
Chronic lymphocytic leukemia (CLL) is the most common form of leukemia in adults and is characterized by a progressive accumulation of functionally incompetent lymphocytes in blood and bone marrow. Recent bulk RNA sequencing studies suggest that there is heterogeneity within CLL samples, demonstrating that single-cell RNA sequencing is necessary to characterize the underlying transcriptional profile. Here is an example of how the BD Rhapsody™ Single-Cell Analysis System was used to simultaneously analyze gene and protein expression in single cells from clinical CLL samples.
Experimental Outline
(Right) Peripheral blood mononuclear cells (PBMCs) from a total of three healthy donors and four CLL samples were simultaneously stained with BD® Single-Cell Multiplexing Kit reagents, fluorochrome-labeled antibodies and 33 BD® AbSeq Markers. CD19+ cells from different samples were then sorted using the BD FACSMelody™ Cell Sorter and pooled together prior to being loaded on the BD Rhapsody™ System. cDNA was synthesized and processed for library preparation using the targeted BD Rhapsody™ Immune Response Panel (399 genes) before sequencing. Data were analyzed using the BD Rhapsody™ Analysis Pipeline and SeqGeq™ v1.6 Software.
BD Fluorochrome-Labeled Antibodies Used for Sorting
| Marker | Fluorochrome |
|---|---|
| CD3 | APC |
| CD14 | APC |
| CD16 | APC |
| CD19 | PE |
| CD41a | APC |
| CD56 | APC |
| CD235a | APC |
List of fluorochrome-conjugated antibodies (above) and BD® AbSeq Antibodies (right) used in this study.
| AbSeq Marker | |||
|---|---|---|---|
| CD4 | CD24 | CD80 | CD184 |
| CD5 | CD27 | CD81 | CD275 |
| CD7 | CD33 | CD86 | CD279 |
| CD8 | CD34 | CD90 | CD294 |
| CD9 | CD38 | CD103 | IgG |
| CD10 | CD40 | CD117 | IgD |
| CD11c | CD45 | CD123 | |
| CD19 | CD45RA | CD127 | |
| CD20 | CD69 | CD133 | |
Multiomic analyses of healthy versus disease samples
To analyze the data generated from the above described workflow, t-SNE analysis was performed on four CLL samples and three healthy donor samples using mRNA expression, surface protein expression or a combination of both. The t-SNE plot generated based on AbSeq data showed higher level of separation among different samples compared to using RNA-Seq data alone. A combination of both mRNA and AbSeq data greatly improved the resolution of different samples. Four CLL samples formed distinct clusters individually whereas the healthy samples overlapped to a greater extent in the t-SNE plot, suggesting the clinical course of CLL patients can be heterogeneous. These results also highlight the power of multiomics in analyzing single-cell profiles.

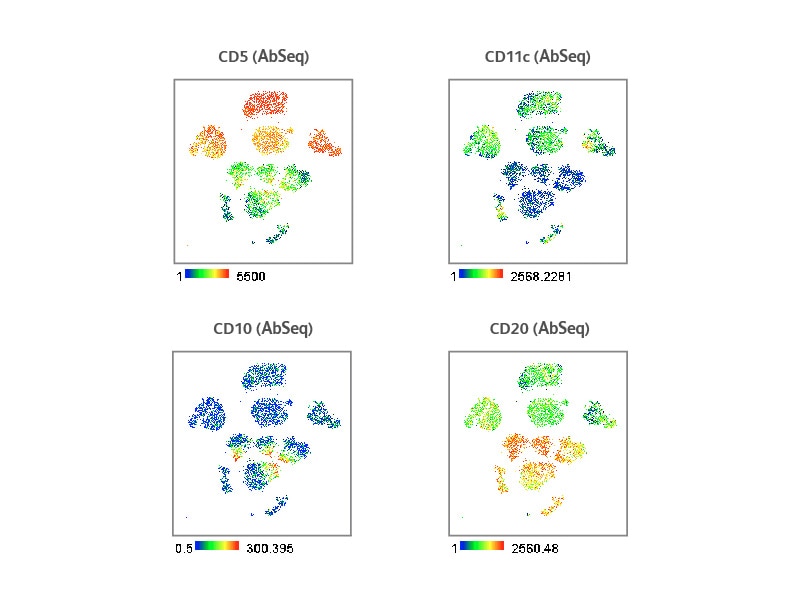
Differences in key protein markers identified by AbSeq analyses
CLL is characterized by clonal expansion and accumulation of CD5+ B lymphocytes. Additionally, malignant B cells in CLL patients can also express CD11c at higher levels. BD® AbSeq Reagents revealed higher expression of CD11c and CD5 in CLL samples compared to healthy donors, correlating to pathogenesis of CLL. On the other hand, low CD10 and CD20 expression were observed in CLL samples compared to healthy donors, which is consistent with published literature.
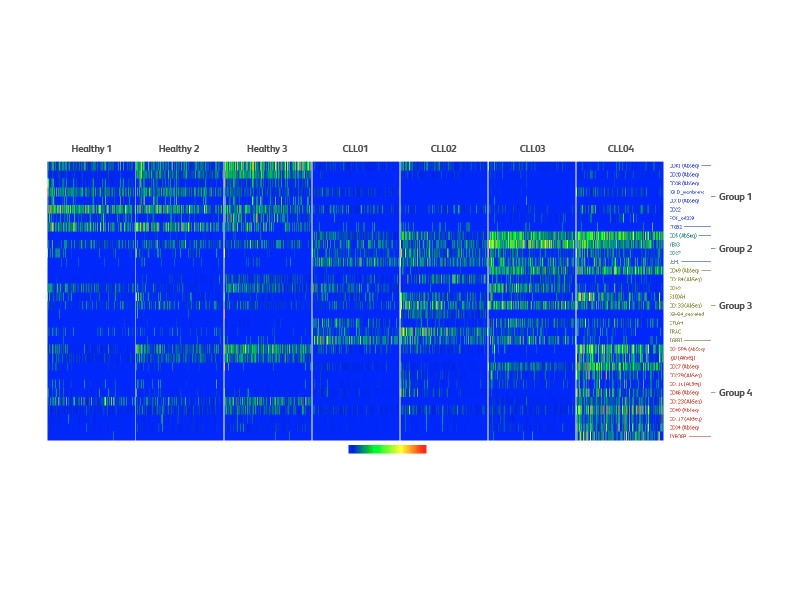
Analysis of differentially expressed markers across healthy and CLL samples
To understand the markers underlying the distinct clustering between healthy and CLL samples, a differential expression analysis was performed using single-cell mRNA and AbSeq data. This analysis identified markers that were decreased in CLL samples compared to healthy samples (Group 1). Genes or proteins that were differentially increased in all CLL samples are listed in Group 2 (all CLL), while Group 3 lists those which are up in some CLL samples. CD5, the marker aberrantly expressed in CLL patients, was higher in CLL03 and CLL04 compared to other samples. Also, a subset of markers that were specifically associated with CLL04 (Group 4) was also discovered, such as CD11c. Interestingly, not all cells produce CD11c at the same level, suggesting intra-tumoral heterogeneity of CLL.
Summary
This study was focused on investigating the differences between three healthy and four CLL samples, utilizing ~500 targeted genes and 33 BD® AbSeq Antibodies. Combining both mRNA and AbSeq data clustered the CLL and healthy samples into distinct groups. Unique markers that are differentially expressed in the CLL samples compared to the healthy control samples were identified in this study. Significant heterogeneity was observed across CLL samples, particularly in the CLL04 sample. Overall, single-cell multiomics of CLL samples revealed novel insights about their unique molecular signature. Such insights for cancers like CLL can potentially aid in designing better therapies. For additional details, download the CLL heterogeneity datasheet detailing the above study.
Immunology research—T cell biology
BD has championed in developing cutting-edge tools to drive immunology research for decades. We continue to support immunologists in their single-cell multiomics research as well. Read below to learn about the use of the BD Rhapsody™ Single-Cell Analysis System to address key immunology research questions.
T cell exhaustion study
Deeper characterization of exhausted T cells
Understanding the basis of activation and exhaustion in cell types like T cells has now become the foundation for development of immunotherapy. In some of the fast-developing areas of immunotherapy, like CAR-T therapy, this is becoming even more critical. A key step in the clinical production of CAR-T cells is the expansion of engineered T cells. To generate enough cells for a therapeutic product, cells must be chronically stimulated, which raises the risk of inducing T cell exhaustion and reducing therapeutic efficacy. As protocols for T cell expansion are being developed to optimize CAR T cell yield, function and persistence, fundamental questions about the impact of in vitro manipulation on T cell identity are important to understand. Keeping this in mind, the study described below demonstrates how some of these underlying fundamental questions can be addressed by performing single-cell multiomic analysis utilizing a routinely used model of T cell activation.
Experimental design
(Right) Magnetically enriched T cells from PBMCs were stimulated for 3 days in the presence of IL-2 and CD3/CD28 Dynabeads™ Magnetic Beads. Chronic stimulation was carried over for an additional 11 days. Transient stimulation was performed by removing the Dynabeads™ Magnetic Beads and culturing the cells in the presence of IL-2 only for an additional 11 days. A total of five samples were collected and frozen—fresh T cells, cells stimulated for 3, 7 and 14 days (chronically stimulated), and cells stimulated for 3 days and rested for 11 days (transiently stimulated).
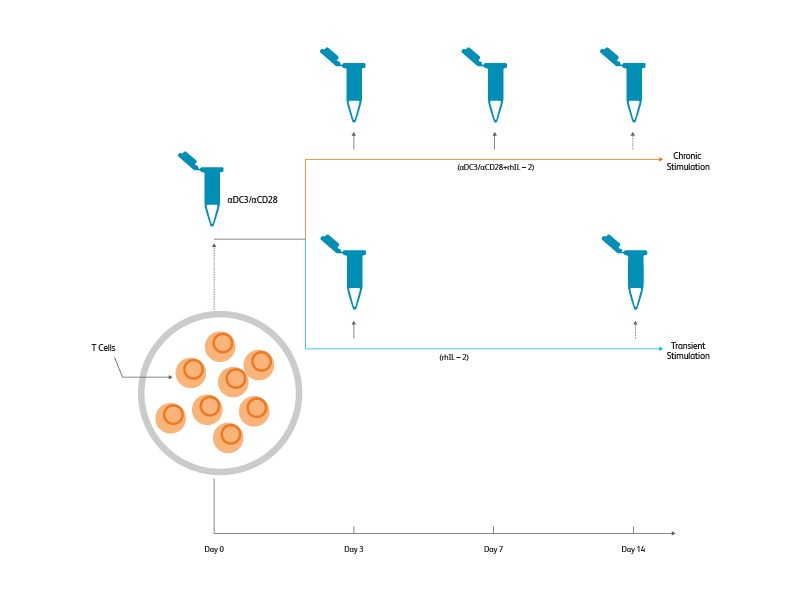
(Right) Two aliquots were generated from each time point. One aliquot of each sample was thawed and stained with 39 BD® AbSeq Antibodies and BD® Single-Cell Multiplexing Antibodies. The samples were pooled and loaded into two BD Rhapsody™ Cartridges (~3,000 cells/sample). The BD Rhapsody™ T-Cell Targeted Panel was used to assess the mRNA expression level in these samples. The second aliquot of frozen cells was stained with a 12-color flow cytometry panel and analyzed on the BD LSRFortessa™ X-20 Cell Analyzer.
BD® AbSeq Antibodies and flow antibodies used in the current study
The BD® AbSeq Panel identifies 39 proteins that play roles in T cell activation, inhibition/exhaustion, differentiation or chemotaxis. A companion 12-color flow cytometry panel with selected, overlapping specificities was also designed to assess concordance between flow cytometry and AbSeq technology. scRNA-Seq panel includes 400 genes involved in immune response. All data shown here were from CD8+ T cells.
| 39-Plex BD® AbSeq Panel | |||
|---|---|---|---|
| CD4 | CD278 (ICOS) | CD103 | CD94 |
| CD8 | CD178 (FAS-L) | CD30 | CD95 |
| CD279 (PD-1) | CD183 (CXCR3) | CD38 | CD98 |
| CD223 (LAG-3) | CD185 (CXCR5) | CD39 | CD2 |
| CD366 (TIM-3) | CD194 (CCR4) | CD44 | TCRab |
| CD272 (BTLA) | CD196 (CCR6) | CD45RA | CD154 |
| CD357 (GITR)/td> | CD137 (4-1BB) | CD49a | CD7 |
| CD226 (DNAM-1) | CD134 (OX40) | CD54 | CD2 |
| CD152 (CTLA-4) | CD27 | CD62L | CD25 |
| CD270 (HVEM) | CD28 | CD69 | |
List of BD® AbSeq Antibodies (above) and fluorochrome-conjugated antibodies (right) used for this study.
| 12-Color Flow Cytometry Panel | ||
|---|---|---|
| Marker | Fluorochrome | |
| CD4 | BUV805 | |
| CD8 | BUV395 | |
| CD279 (PD-1) | PE-Cy7 | |
| CD152 (CTLA-4) | PE | |
| CD223 (LAG-3) | BV480 | |
| CD366 (TIM-3) | BV711 | |
| CD39 | BUV737 | |
| CD103 | APC | |
| CD45RA | APC-H7 | |
| CD62L | FITC | |
| CD95 | BV786 | |
| CD357 (GITR) | BV421 | |
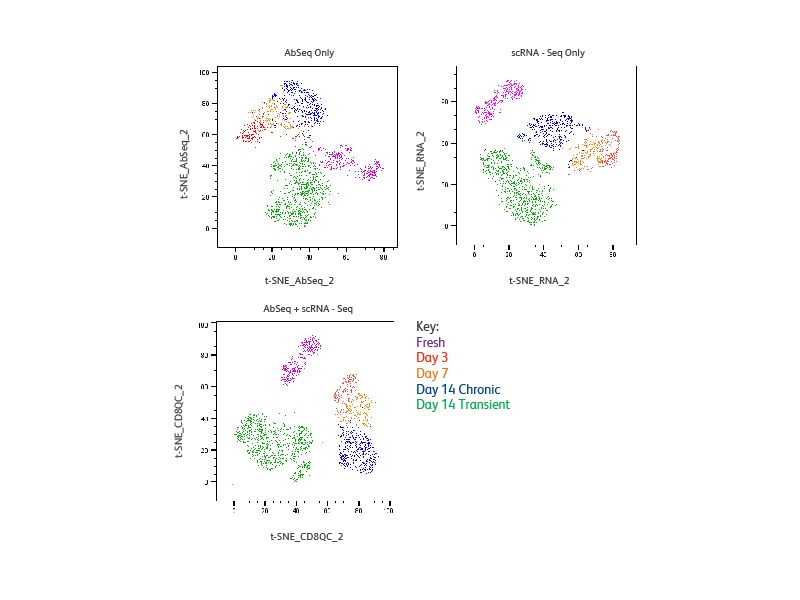
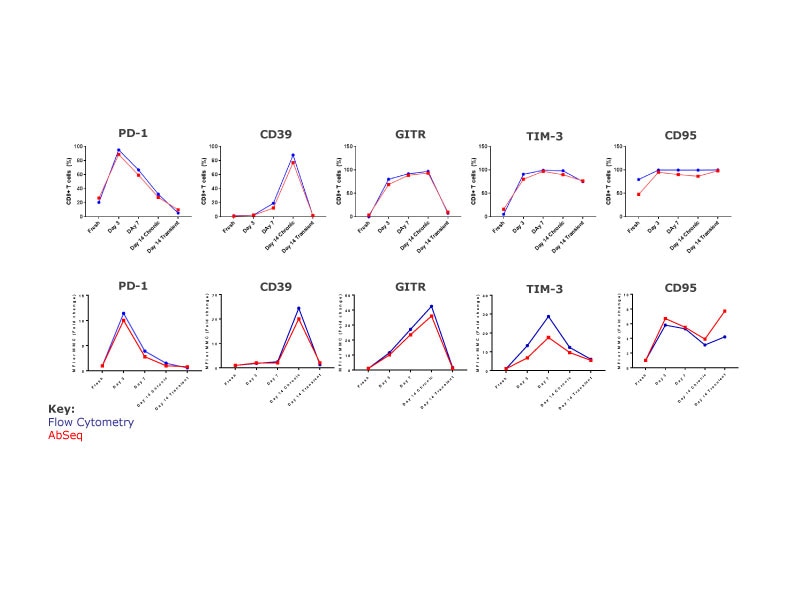
T cell analyses
Distinct clusters are resolved for each sample and the resolution is equivalent for clustering based on protein only, mRNA only or a combination of both. The transiently stimulated cell clusters (Day 14) appear separately from both fresh T cells and chronically stimulated cells, suggesting a distinct signature, in contrast to previous observation, suggesting that they are phenotypically and functionally similar to fresh cells. Chronically stimulated cells (Day 3, 7 and 14) form clusters that are separate from fresh cells. The three samples form distinct clusters, suggesting they each have unique signatures.
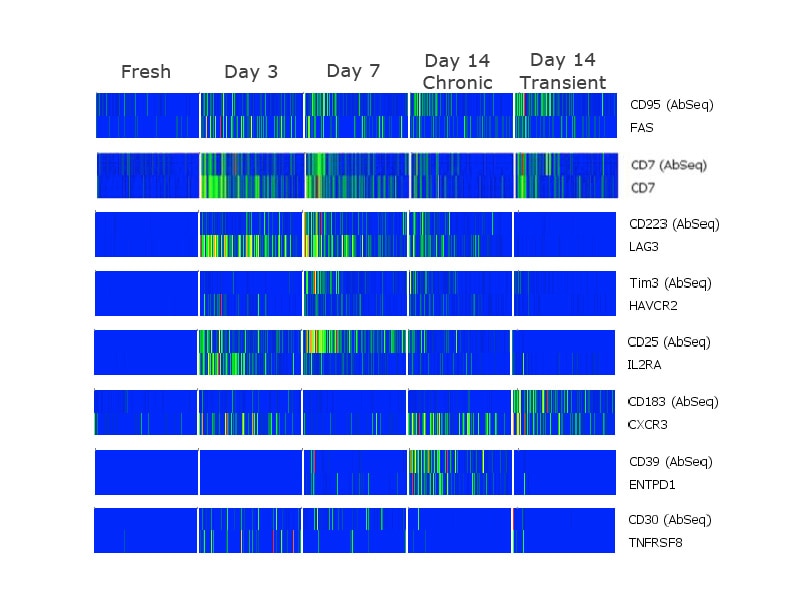
Analyzing correlation between protein and gene expression at a single-cell level
Analyzing the protein and mRNA signatures of the different populations revealed several insights. Some of these include markers like CD7 where the protein and mRNA expression displayed strong correlation throughout the different time points. CD103 (ITGAE) mRNA was upregulated at Day 3 of activation, while protein expression increases later, at Day 7. In chronically stimulated cells, CD38 mRNA was upregulated at Day 3 and increases over time, whereas protein expression increases later, at Day 14. In transiently stimulated cells, CD38 protein was expressed at Day 14 even though mRNA expression was not maintained.
Concordance of BD® AbSeq Marker data with flow cytometry
The kinetics of protein expression as demonstrated by the percent of CD8 T cell expression markers and the respective level of these cell surface markers detected by both flow cytometry and AbSeq was consistent. These data strongly demonstrate the concordance and utility of both these technologies to study protein expression.
Summary
Use of AbSeq allowed an extensive analysis of a high number of proteins (39 in this study) in a simplified workflow. AbSeq technology enabled resolution of different classes of antigens (primary, secondary, tertiary) that are expressed at various densities (from low to high) on subsets of cells present at different frequencies (from rare to abundant). Additionally, using BD Rhapsody™ System reagents, this study detected changes in expression of both genes and proteins concomitantly over time in different stimulation conditions. Simultaneous analysis of protein and mRNA expression allowed assessment of correlation of mRNA and protein expression to determine potential mechanisms of regulation, leading to a more refined and deeper cell characterization. For additional details, download the T cell exhaustion datasheet detailing the above study.
Regulatory T cell study
Comprehensive characterization of regulatory T cells via single-cell multiomic analysis
Regulatory T cells (Tregs) play an essential role in maintaining immune homeostasis and their alterations can have many implications including tumor progression or onset of autoimmune diseases. Tregs are not a functionally homogenous population and can be subgrouped based on the expression of CD45RA and HLA-DR as naïve or activated Tregs, respectively. This study utilized the BD Rhapsody™ Human Immune Response Panel and BD® AbSeq Antibodies to further dissect Treg subsets and identify putative cell differentiation trajectories. Twenty-two proteins including stimulatory/inhibitory receptors and cytokine/chemokine receptors and 399 mRNA transcripts were analyzed at the single-cell level.
Experimental design
(Right) Peripheral blood mononuclear cells (PBMCs) from a healthy donor were co-stained with fluorochrome-conjugated antibodies for cell sorting and BD® AbSeq Antibodies for downstream sequencing-based protein detection. The sample was sorted for CD4+CD25+CD127low/− Tregs, and 5,000 sorted Tregs were loaded onto the BD Rhapsody™ Single-Cell Analysis System for single-cell capture. After sample retrieval, BD® AbSeq and mRNA (BD Rhapsody™ Human Immune Response Panel) libraries were prepared for sequencing. The sequencing results were analyzed with the BD Rhapsody™ Analysis Pipeline and SeqGeq™ Software.
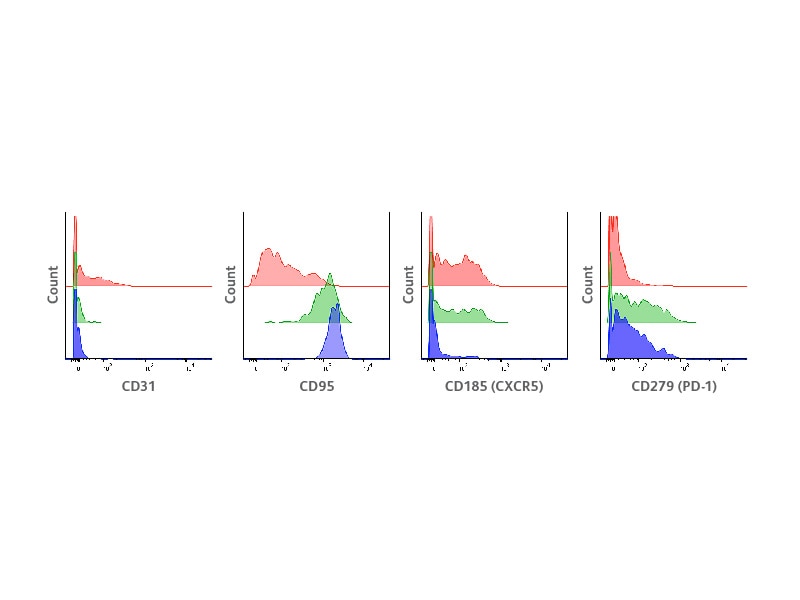
Phenotypic characterization of Tregs cells with BD® AbSeq Antibodies
In this study, the ability of BD® AbSeq Antibodies to clearly identify major Treg subsets previously defined using other technologies was first assessed. The result shows that BD® AbSeq Antibodies enabled a clear resolution of antigens expressed over a continuum such as CD45RA and HLA-DR, which define naïve and activated Tregs, respectively. The expression of selected markers was measured within the CD45RA+HLA-DR− naïve cells, CD45RA−HLA-DR+ activated cells and CD45RA−HLA-DR− cells. In agreement with previous reports, CD31 was exclusively detected in a small subset of CD45RA+HLA-DR− naïve Tregs, representing recent thymic emigrants (RTEs). On the other hand, CD95 was expressed in both CD45RA−HLA-DR− and CD45RA−HLA-DR+ activated populations, consistent with previous report that identified CD95+ apoptosis-sensitive cells within activated Tregs. Distinct expression patterns were also observed for the chemokine receptor CD185 (CXCR5) and the inhibitory receptor CD279 (PD-1).
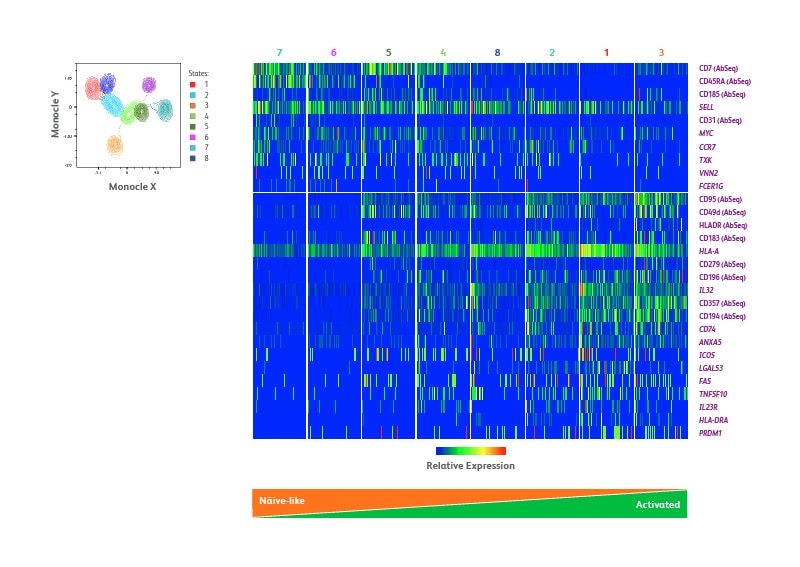
Characterization of Treg differentiation by Monocle analysis
Unsupervised high-dimensional data analysis was used to refine the identification of Treg subsets. The Monocle algorithm was used to perform single-cell trajectory analysis and define transitional states of differentiation processes. Based on the expression of 22 protein and 399 mRNA targets, eight distinct states were identified, likely representing distinct differentiation states of Tregs. The single-cell heatmap in the figure below (B) displays selected proteins and genes differentially expressed across the eight states. Cells belonging to each state were arranged, from left to right, based on progressive loss of CD45RA and upregulation of HLA-DR, to represent a progression from naïve to activated cells. In addition to the differential levels of CD45RA expression, these three states could be further discriminated because CD31 is exclusively expressed in state 7 cells, consistent with the signatures of RTEs. On the other hand, the exclusive expression of CD95 and concurrent downregulation of CD45RA in state 5 may suggest a transition from naïve to apoptosis-sensitive and activated cells.
Summary
This study demonstrates the sensitivity and specificity of the BD Rhapsody™ Platform and its multiomic tools, e.g., BD® AbSeq Antibodies, for the identification of Treg subsets based on known surface marker signatures. The combination of single-cell multiomics and high-dimensional data analysis further enabled a clear resolution of distinct subsets of Tregs defined by unique protein and gene expression signatures, likely representing unique differentiation states of Tregs.
For additional details download the regulatory T cells datasheet detailing the above study.
Immunology research—innate immune system
Innate lymphoid cells (ILC)
Resolving human circulating innate lymphoid cell heterogeneity using single-cell multiomic analysis
Innate lymphoid cells (ILCs) constitute a recently identified family of lymphoid cells that do not express rearranged antigen receptors and have key functions in inflammation, infection, cancer, metabolic disorders and allergies. They represent a heterogeneous population including classically defined natural killer (NK) cells as well as more recently described non-cytotoxic ILCs. Three major groups of non-cytotoxic ILCs have been characterized in mucosal and non-mucosal tissues based on distinct patterns of cytokine production and transcription factor expression. However, recent publications using single-cell RNA sequencing (scRNA-Seq) or high-parameter mass cytometry showed the existence of more than just three groups of ILCs; hence better understanding of ILC heterogeneity is needed to determine their roles in disease pathogenesis and to determine whether targeting of ILCs will help to prevent or treat these diseases. The emergence of single-cell multiomic technologies provides an opportunity to further resolve ILC heterogeneity by enabling integration of phenotypic and transcriptional data from the same cell.
Experimental outline
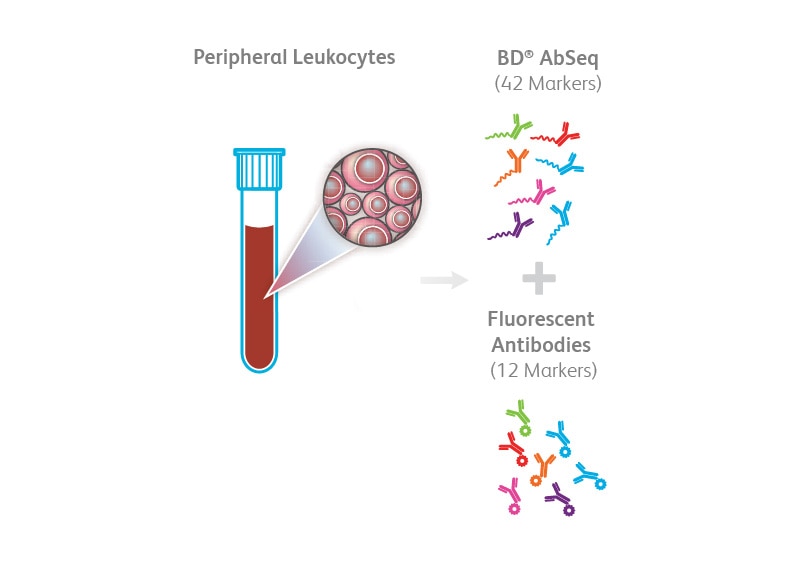
Peripheral blood leukocytes were isolated using HetaSep™ (STEMCELL Technologies) and labeled with a panel of 12 fluorochrome-conjugated antibodies for cell sorting. Cells were also simultaneously stained with 42 oligonucleotide-conjugated BD® AbSeq Antibodies for downstream protein detection via next-generation sequencing. A BD Horizon Brilliant Violet™ 510 (BV510) Dye-labeled cocktail of CD19, CD14, TCRγδ, TCRαβ, CD123, CD1a, BDCA2 and FCεR1α antibodies was used as a “dump channel” to exclude lineage cells. To ensure clear resolution and exclusion of T and NK cells, CD3 and CD56 antibodies were additionally included in the sorting panel. Total ILCs were defined as Lineage-CD45+CD127+ cells and were sorted using a BD FACSAria™ Fusion Cell Sorter and loaded into the BD Rhapsody™ Single-Cell Analysis System for single-cell capture. After sample retrieval, single-cell BD® AbSeq and mRNA (BD Rhapsody™ Human Immune Response Panel) libraries were prepared for sequencing. Data were analyzed using the BD Rhapsody™ Analysis Pipeline and SeqGeq™ Software. Biological information discovered using single-cell analyses was then utilized to guide the design of a high-parameter flow cytometry panel. The information derived from multiomic analysis was validated by analyzing peripheral blood ILCs from four different healthy donors using a 21-color flow cytometry panel on the BD FACSymphony™ A5 Cell Analyzer.
| Marker | Clone | Fluorochrome |
|---|---|---|
CD19 CD14 TCRγδ TCRαβ CD1a CD123 BDCA2 FCεR1α | SJ25-C1 MϕP9 11F2 IP26 HI149 9F5 V24-785 AER-37 | BV510 |
| CD45 | 2D1 | FITC |
| CD3 | SK7 | APC-H7 |
| CD56 | B159 | PE-Cy7 |
| CD127 | HIL-7R-M21 | BV421 |
List of fluorochrome-conjugated antibodies used for sorting Lineage−CD45+CD3−CD56−CD127+ total ILCs
BD® AbSeq Panel
| Marker | Clone |
|---|---|
| CD2 | RPA-2.10 |
| CD3 | SK7 |
| CD4 | SK3 |
| CD5 | UCHT2 |
| CD7 | M-T701 |
| CD8 | RPA-T8 |
| CD11b | M1/70 |
| CD11c | B-LY6 |
| CD14 | MϕP9 |
| CD16 | 3G8 |
| CD19 | SJ25C1 |
| CD25 | 2A3 |
| CD27 | M-T271 |
| CD28 | CD28.2 |
| CD34 | 581 |
| CD45RA | HI100 |
| CD49a | SR84 |
| CD49d | 9F10 |
| CD56 | NCAM16.2 |
| CD62L | DREG-56 |
| CD69 | FN50 |
| Marker | Clone |
|---|---|
| CD90 | 5E10 |
| CD94 | HP-3D9 |
| CD98 | UM7F8 |
| CD103 | BER-ACT8 |
| CD117 | YB5.B8 |
| CD125 (CTLA-4) | BNI3 |
| CD161 | DX12 |
| CD183 (CXCR3) | 1C6/CXCR3 |
| CD184 (CXCR4) | 12G5 |
| CD196 (CCR6) | 1149 |
| CD223 (LAG-3) | T47-530 |
| CD226 (DNAM-1) | DX11 |
| CD274 (PD-L1) | MIHI |
| CD275 (B7-H2 | 2D3/B7 |
| CD278 (ICOS) | DX29 |
| CD279 (PD-1) | EH12.1 |
| CD294 (CRTH2) | BM16 |
| CD314 (NKG2D) | 1D11 |
| CD335 (NKp46) | 9E2/NKP46 |
| CD336 (NKp44) | p44-8 |
| CD366 (TIM-3) | 7D3 |
List of BD® AbSeq Oligonucleotide-Conjugated Antibodies used for single-cell multiomic analysis of sorted total ILCs.
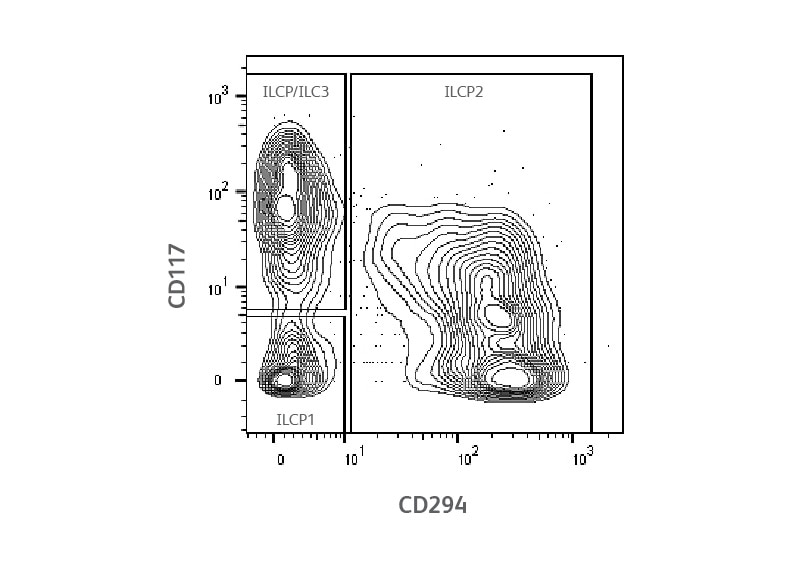
Differences in major ILC subgroups revealed by multiomic analyses
Data analysis was initially performed by manually gating the three major groups of circulating ILCs conventionally defined as CD117− CD294− ILC1, CD117+/−CD294+ ILC2 and CD117+CD294− ILC progenitors/ILC3 (ILCP/ILC3). A differential expression analysis was performed between the three ILC groups using single-cell AbSeq and mRNA data and identified unique protein and mRNA signatures for each group. This analysis also revealed expected expression patterns for key transcription factors defining ILC groups. For example, the gene encoding T-bet (TBX21) was exclusively expressed in a subset of ILC1 cells, whereas GATA3 was expressed at highest levels in ILC2 cells. As recently reported, RORC, encoding RORγδ, was partially expressed by circulating ILC progenitors displaying an ILC3 phenotype (CD117+CD294− ILCP/ ILC 3 cells).
Insights about the heterogeneity of ILC1 population
The single-cell heatmap also revealed heterogeneity within each ILC group as most of the represented markers were not uniformly expressed by all the cells. These data therefore suggest that additional subsets exist within each group of ILCs. For example, CD4 was exclusively expressed by the majority, but not all, ILC1 cells. This observation agrees with previous reports and was further confirmed by bi-variate plot analysis clearly showing discrete subsets of CD4+ and CD8+ cells within ILC1 but not ILC2 or ILCP/ILC3 cells.

Single-cell multiomic analysis of ILC1 heterogeneity
To further investigate the heterogeneity of ILC1 cells, a differential gene and protein expression analysis was performed between the three subsets of CD4+CD8−, CD4−CD8+ and CD4−CD8− ILC1 populations. Figure B (above) shows a single-cell heatmap displaying representative protein and gene signatures associated with each subset and illustrates the high heterogeneity and complexity of the ILC1 subset. These data demonstrate the power of a single-cell multiomic approach to screen a high number of proteins and genes and discover critical markers required to define and discriminate unique cell subsets within highly heterogeneous samples.
Of the 42 AbSeq markers tested, this study identified 13 surface markers differentially expressed between the three subsets of ILC1. Also, one differentially expressed gene (CD63) coding for the surface protein CD63 was identified. Further, a 21-color flow cytometry panel was designed based on the learnings from the multiomic data generated to rapidly profile multiple samples for ILC’s (data not shown).
Summary
In this study, a complete workflow for deep characterization of circulating human ILCs was established. Cell sorting enabled the purification of total ILCs for simultaneous downstream analyses of the expression of 42 proteins and 399 genes. Single-cell multiomic analysis revealed complex immunophenotypic and molecular signatures refining the identity of the three main groups of ILCs. The analysis also revealed heterogeneity within ILC1 cells leading to the discovery of markers defining distinct ILC1 cell populations. The biological information provided by the single-cell multiomic screening was instrumental for the design of a high-parameter flow cytometry panel that could be used to deeply characterize ILC1 cells from multiple donors. For additional details, download the ILC datasheet detailing the above study.
Metabolic disease research
Interrogating immune cells signature in mouse models of obesity using single-cell multiomics
Obesity is a major risk factor for the development of various diseases such as type-2 diabetes, cardiovascular disease and cancer. The transition from a simple adiposity to a disease state correlates with an increase in local and systemic inflammation and is also marked by alterations in the number and function of immune cells. Macrophages are an important source of adipose tissue inflammation and several changes in T cell populations are also involved with the development of obesity in animal models. Interrogating these changes through an integrated analysis of mRNA and protein expression at the single-cell level, can offer deeper insights about how high-fat diet (HFD) can induce inflammation and ultimately drive obesity-related disorders. Here is an example of how BD Biosciences flow cytometry and single-cell analysis tools can be used to interrogate immune cells using mouse models of obesity.
Experimental outline
(Right) Thirty proteins and 399 targeted mRNAs were analyzed in this study in approximately 20,000 single cells derived from multiple tissues of mice that received different diet regimens. Through analysis of cell differentiation and activation markers, numerous cell compartments and observed distinct alterations associated with HFD were examined. The HFD and control diet mice were obtained from Jackson Laboratories. Seven-week-old mice were placed on either a control diet or HFD for 17 weeks. Single-cell suspensions were prepared from bone marrow, thymus, spleen and epididymal adipose tissue. Following tissue collection and dissociation, the eight samples indicated in the figure were stained with one of the 12 unique DNA-barcoded antibodies from the BD® Mouse Immune Single-Cell Multiplexing Kit and 30 BD® AbSeq Mouse Antibodies. BD Pharmingen™ FITC Rat Anti-Mouse CD45 Antibody was included in the staining of adipose tissue cells and CD45+ cells were sorted on the BD FACSAria™ Fusion Cell Sorter. The eight samples were pooled and loaded onto the BD Rhapsody™ Single-Cell Analysis System. After sample retrieval, BD® AbSeq, Sample Tag and mRNA (BD Rhapsody™ Mouse Immune Response Panel) libraries were prepared for sequencing. The sequencing results were analyzed with the BD Rhapsody™ Analysis Pipeline and SeqGeq™ Software.

A. Experimental overview and the BD Rhapsody™ System workflow. B. List of BD® AbSeq Antibodies used in this study.
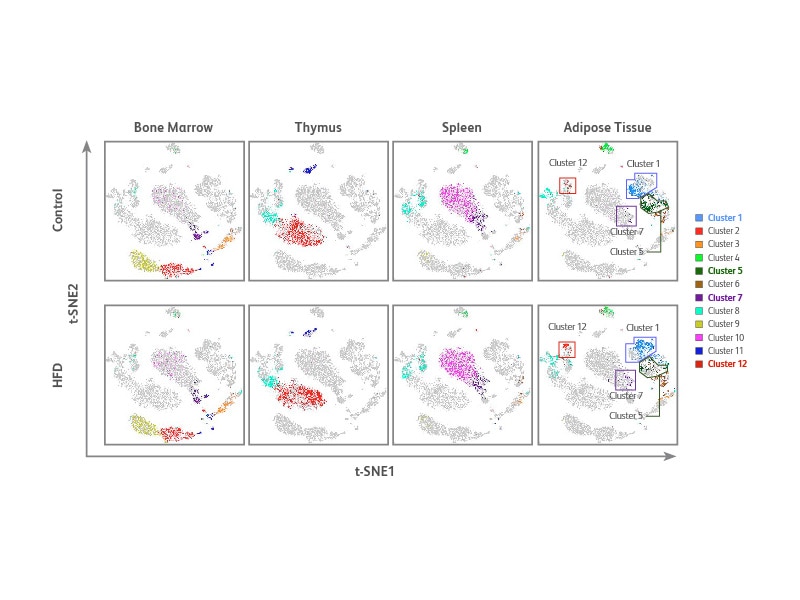
Unbiased cell clustering identifies multiple cell phenotypes across different samples
t-SNE was generated using the multiomic data generated from the above experiment for data visualization and an unbiased clustering algorithm PhenoGraph, SeqGeq™ Software plug-in, for detection of cell populations. PhenoGraph identified 12 cell clusters across the four different tissue types. Of the 12 clusters, four showed differences in cell density and distribution in the adipose tissue of HFD mouse compared to control clusters 1, 5, 7 and 12.
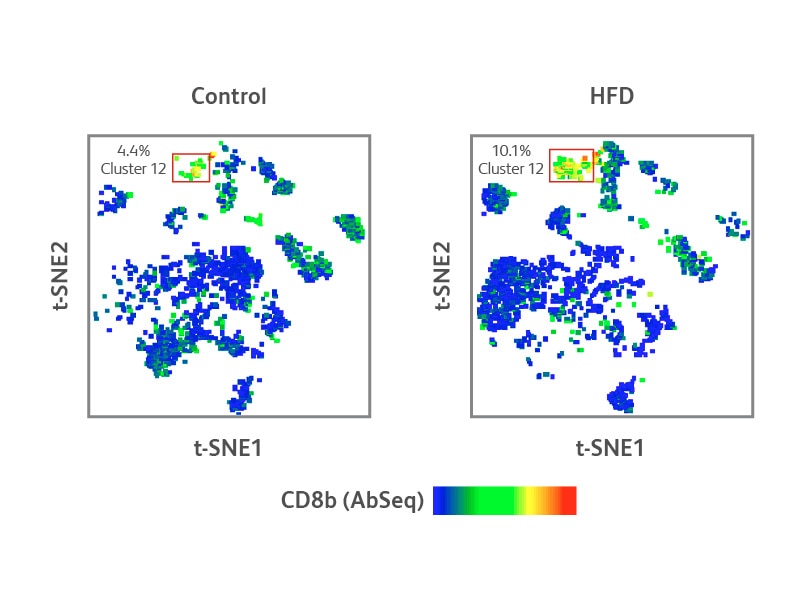
Single-cell protein and targeted mRNA-Seq analyses of CD8+ T cells in adipose tissue from control and HFD mice
(Right) Characterization of cluster 12 revealed a high expression level of CD8b on the surface of these cells, suggesting this cluster was primarily comprised of CD8+ T cells. Notably, cluster 12 of the HFD mouse presented a higher concentration of CD8+ T cells than the controls. Differential mRNA and protein expression analyses of this cluster showed an elevated expression of Pdcd1 (CD279, PD-1 mRNA), Lag3 and Tigit, which are putative markers of cells undergoing exhaustion (Panel B).
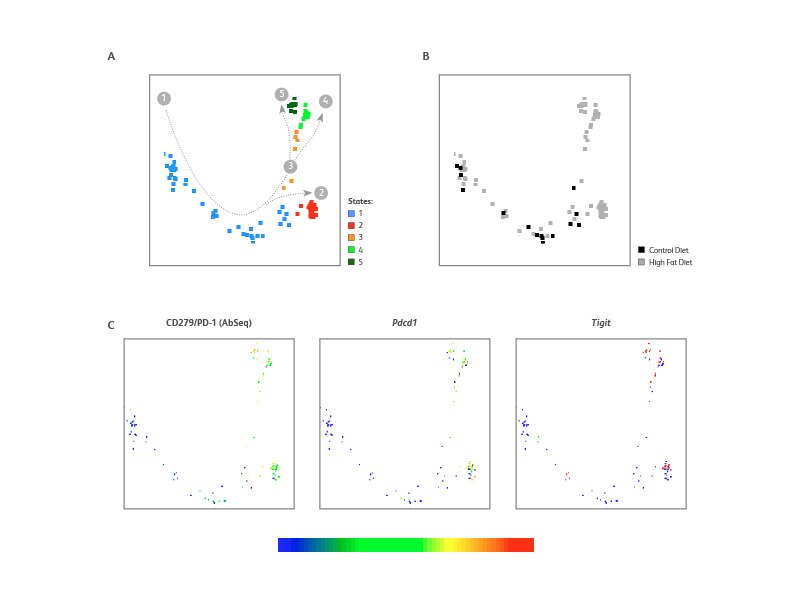
Monocle analysis of CD8+ T cells from HFD adipose tissue suggests that these cells underwent cell exhaustion
Specific analysis of CD8+ T cells in the adipose tissue using Monocle discriminated five developmental states. The CD8+ T cells from the control mouse belonged to states 1 and 2 whereas cells from the HFD mouse further followed a trajectory toward states 3, 4 and 5. States 2, 3, 4 and 5 from the HFD mouse presented an elevated expression of exhaustion markers such as CD279 (PD-1) protein and mRNA (Pdcd1) as well Tigit.
Summary
These results demonstrate that single-cell analysis performed on the BD Rhapsody™ Single-Cell Analysis System using BD® AbSeq Antibodies and the BD Rhapsody™ Mouse Immune Response Panel provides unique insights about metabolic disorders like obesity. This comprehensive single-cell analysis platform in combination with powerful bioinformatic tools helped unravel unique disease state immune cell profiles including signs of CD8+ T cells exhaustion and other new insights for HFD-induced inflammation.
To learn more, download the obesity-induced inflammation study datasheet detailing the above study
For Research Use Only. Not for use in diagnostic or therapeutic procedures.
Dynabeads is a trademark of Thermo Fisher Scientific.
HetaSep is a trademark of STEMCELL Technologies Canada Inc.